
“Educational Attainment, Workforce Trends and the Effectiveness of State Policy in Indiana”
My Keynote talk the Indiana School Boards Association

I was fortunate to provide the keynote talk to the annual conference of the Indiana School Boards Association on September 25th. This is a summary of that talk, in which I tried to make five points that craft a narrative of what’s happening in educational outcomes, policy and funding in Indiana. Together they paint a clear picture of a difficult future that is very different from state rhetoric.
I tried to use some easy visuals to make five points:
First, educational attainment is the driver of economic growth. Though there are some bright spots across Indiana, within the most critical areas we perform poorly.
Second, the effects of school choice, for good or ill are modest. At best, the nearly universal school choice in Indiana demonstrates that most families prefer traditional public schools.
Third, the stress on education, both K-12 and higher education are due to significant reductions in state spending on both.
Fourthly, the shifting emphasis away from post-Secondary education is based on bad data and analysis used by the state’s Department of Workforce Development, which continues to mis-inform both higher education and K-12 leaders. We are getting it wrong almost across the board.
Finally, we need more college ready school graduates, and more college graduates.
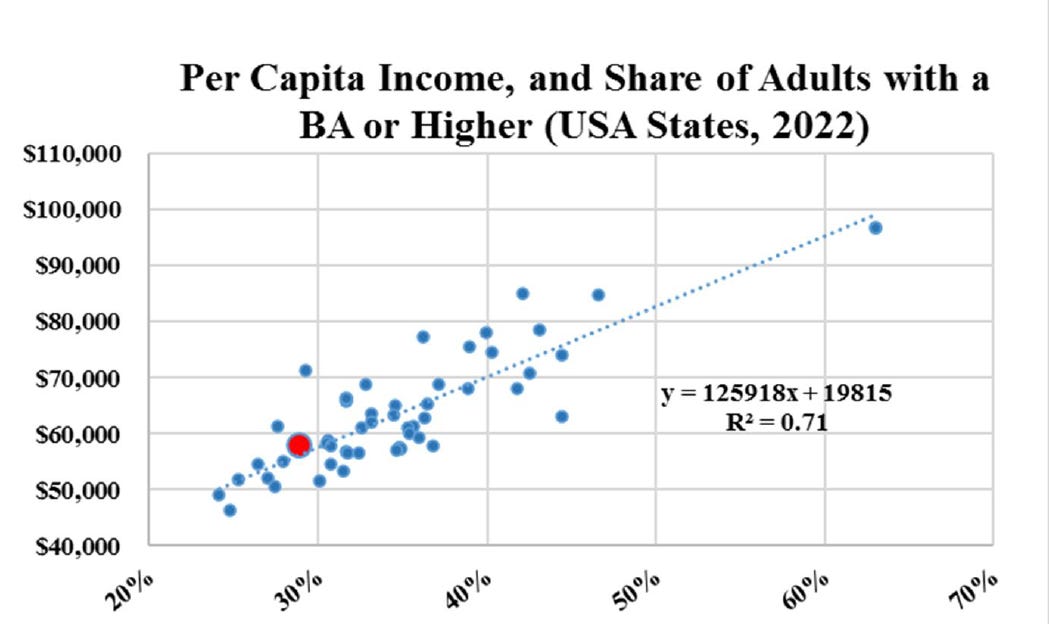
I began with the obvious point that places with higher levels of educational attainment also enjoy higher incomes. Indiana is in red, in this scatter plot of average wage per job and educational attainment in 2020. (Census data)
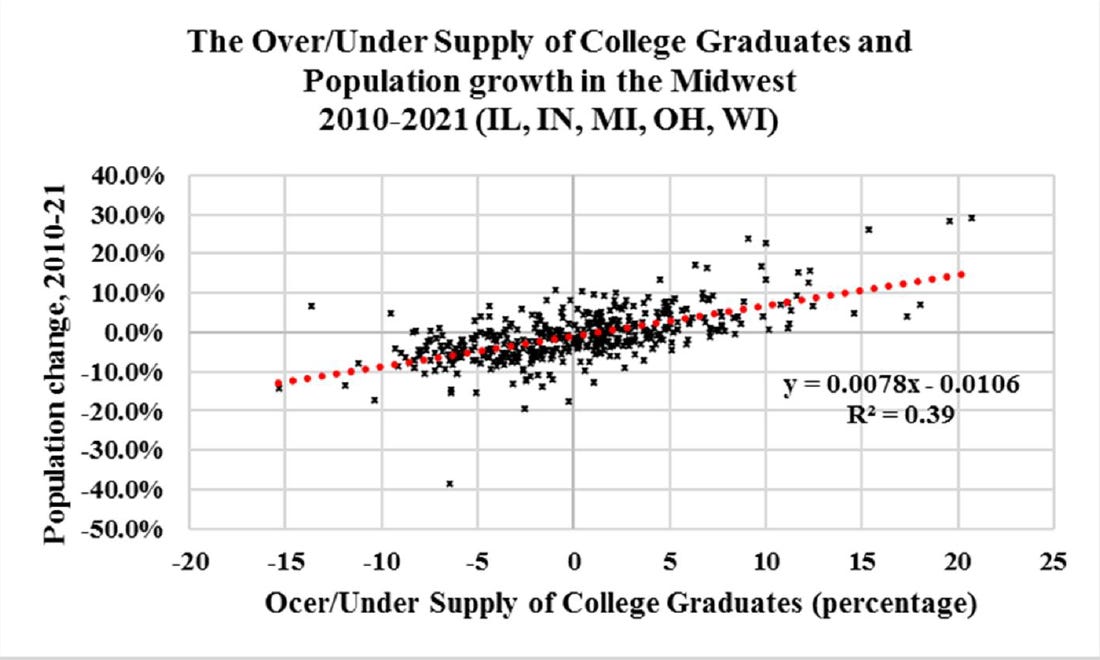
I then make the point that on a lower level (here Indiana counties), educational attainment of the workforce matters in business growth. These data are from a working paper by myself, Amanda Weinstein and Emily Wornell on business dynamics pre and post COVID. Here, the over/undersupply of college graduates in a county is strongly correlated with business dynamics, which I wrote about at some length earlier.
This is not just specific to Indiana, it is true across the Midwest as well.
It would be impossible to assemble a group of School Boards and not discuss the effects of school choice. Indiana has nearly universal school choice. Charter schools began in 2001/2, as a state funded addition to home schooling and private schools. In 2008-10, the state transitioned to a new funding model and allowed students to take their money with them to other local public schools. Vouchers were added two year later, and twice expanded.
Through that time, the share of students in traditional public schools remained remarkably constant. Families in Indiana are choosing traditional local public schools at greater than 15% higher rates than the national average. This graphic doesn’t include home school kids, which I reckon are about 4.1% of students in the 2021/2022 school year. This is down from the 2006 peak of over 6 percent.

The highly volatile changes came in private, home school and charter schools operated by non-school authorities. This chart shows my estimate of each. This is an imperfect estimate, because we don’t know how many kids are home schooled each year. But we do know how many school aged kids there are in Indiana each year (Census data). Likewise, until 2004 we counted homeschool students as private school students. So, I used three different reports on home schooling and private schools, along with the early charter school reporters to reconcile these numbers.

What this graphic shows is that school choice really clobbered private schools and did little for home schooling enrollment. Given more options, families chose charters and local public school choice. I wrote about transfers here, and pointed out that Hoosier families like school choice, but overwhelmingly choose local public schools.
This graphic also shows some key events in school choice. During the early 2000’s charter schools opened slowly, and there was some trade-offs between private and home schooled population. Wider availability of the internet and an explosion of instructional options caused a fairly rapid uptick of home schooling.
Private schooling began to recover slightly through waves of school choice legislation that offered, then expanded vouchers. This ate into the share of students home schooling, while charter schools operated independently (not under local public school control) continued to expand. COVID caused a large uptick in home schooling and private schooling, that continues to be volatile in the post-COVID world.
I tried to explain to the audience that school choice isn’t just here to stay, but is sweeping the nation. And, if I were a legislator, I’d be grateful for it, and support it. It is less expensive to educate kids in alternative settings. That might change with the voucher expansions from last year, but that is an empirical matter for future analysis.
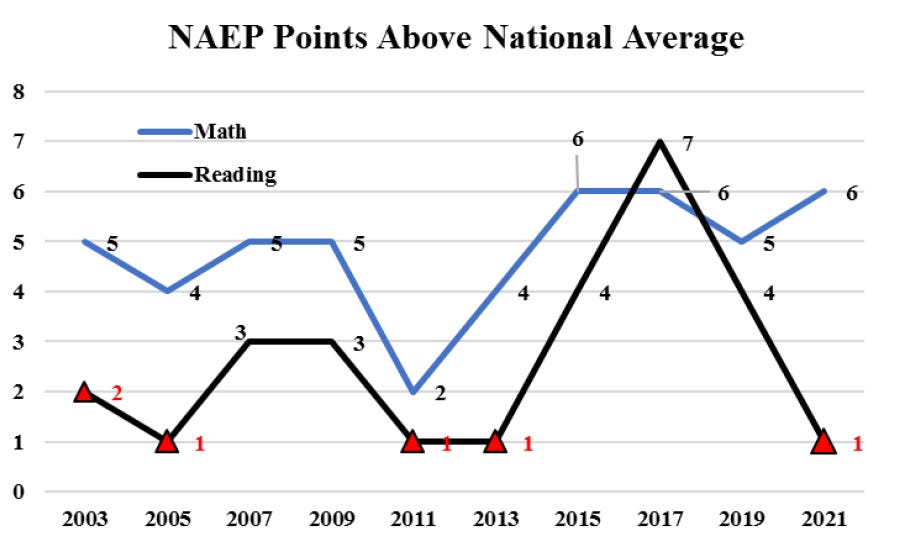
Today, school choice not only allows more people to engage in choice (choice is a good thing) it appears to have pushed public school academic performance higher. These are the NAEP scores for Indiana, and I think the math results here imply success for school choice in an area that is most susceptible to work in the classroom.
I used this point to re-emphasize the role good schools play in regional economic growth. Indiana used grading systems from the late 00’s to 2019. Here I use the 2016 grades and growth in 2016-19. I’ve published work elsewhere looking at this, and it really doesn’t really matter the choice of performance metric (State Grades, pass rates on PSAT or ISTEP+, etc.) nor does the time period matter. Only the best schools are growing.
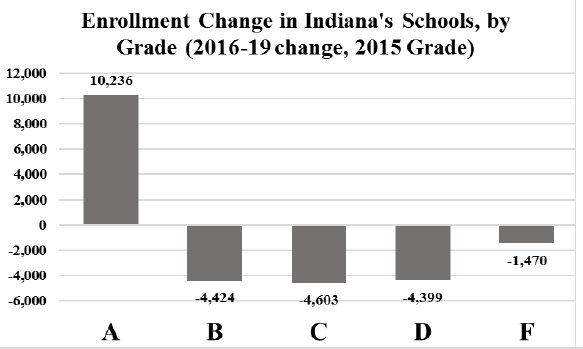
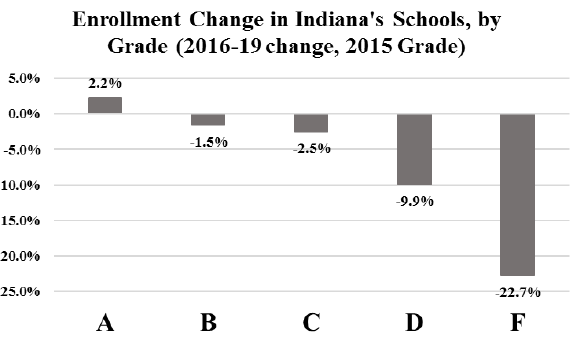
These data are from the IDOE, and omit one F rated school with a large online enrollment (this is formally a charter operated by a public school corporation).
Still, K-12 education in Indiana faces very serious challenges. Perhaps the most difficult is simply the lack of ‘truthiness’ in discussing the budget issue. I start by pointing out that BA holders, working in K-12 have seen pretty sharp erosion of monthly salaries for the past quarter century. These are 4th quarter data on monthly wages of full quarter employed workers, in all elementary and secondary schools with a BA or higher.

I told my audience that as a professor of economics, I teach a number of education majors in my large introductory class. I could hardly commend a career in public education to them. I also noted that they weren’t alone. Monthly pay in higher education across Indiana is below that of 2015 or earlier. I flat told my kids not to consider becoming a professor in Indiana. Go elsewhere.
I noted that this talk isn’t about professors or teachers. We are public employees, and taxpayers should pay us according to market demand and supply. I also noted I’d criticized claims of teacher shortages in 2015. They are real today. The fiscal situation in Indiana has resulted in educational stagnation.
These data (from the National Association of State Budget Officers (NASBO), the Census and IDOE) reveal the simple fact that spending on students (publicly enrolled and receiving vouchers) has not kept pace with inflation. Over the coming two years, this will worsen substantially, since the FY 24/25 budgets are well below expected inflation.
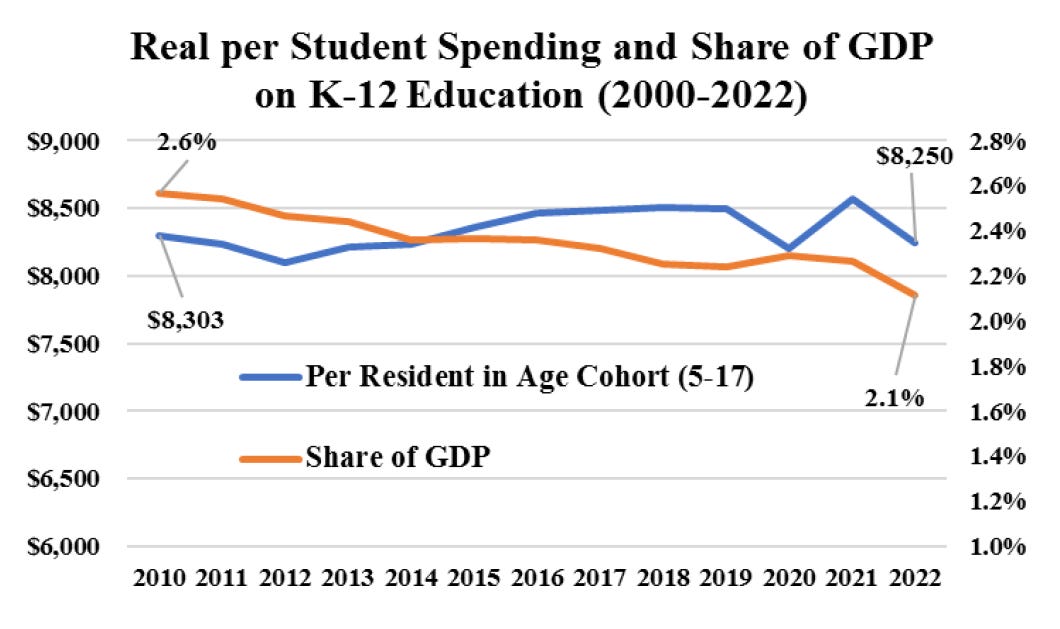
The problem lies in our deep tax cuts. Indiana spent 2.6 percent of GDP on K-12 education in 2010 (the first year of the current funding formulary). Today that share has dropped by half of a percent to 2.1% of GDP. That is $1.8 Billion than we would’ve spent had we kept spending the same, or $1,650 per student each year.
I don’t recall if I mentioned it in my talk, but my inflationary adjustment is conservative. This is the Consumer Price Index, not a Producer Price Index for educational services, that would capture the deeper cuts that are experienced by schools wrestling with exploding healthcare costs and competition from schools outside Indiana
It may be some comfort that K-12 is not alone. Higher education also faces the same problem. Spending on higher education as a share of GDP is down more than 40%. Spending within the cohort of 18-24 year olds heading to college is down 38 percent, or $1,198 per potential student. These data are from NASBO and the Census.

I’ve made the point before, that the cause of declines in higher education in Indiana re due to reduced funding. This is an unpopular take, but it is relatively straightforward truth. I noted that 100% of the decline in the go to college rate in Indiana comes from state public universities. Private schools and out of state colleges are absorbing roughly the same number of kids they did in 2015 (a 100 or so more between the two categories). Indiana’s public universities enrolled 5,000 fewer students this year, than in 2015.
This is not due to a demographic cliff (there are more college aged Hoosiers today than in 2015). It is not due to perceived value of Higher Ed (they are going to private and out of state schools at the same rate). It is due to money, and the way colleges and universities award need based and academic scholarships.

It requires tortured reasoning to ignore the state funding in Indiana’s college attendance collapse. But, what drives the legislatures de-funding of college and de-emphasis of post-secondary education is a series of data blunders offered by the state’s Division of Workforce Development.
This graphic is from an internal document I shared with DWD in 2016 that illustrated their long term forecast for workers in comparison to my forecast and that of IU’s Center for Econometric Modeling. This is a richly illustrative story.

DWD at the time just completely ignored the economists in the state, and even ran out a series of three in-house economists for sharing uncomfortable analysis. Their analysis was solid, but uncomfortable.
This graphic shows the history of employment, my forecast (2014-2024) and the IU/CEMR forecast through 2024. These are total, nonfarm jobs, in the 1,000’s. For this talk, I added the 2023 projection figures to asses the forecasts from all three. As of August 2023, the actual number is 3,266,000. So, My forecast is currently off by 7,000 workers. IU is off by 15,000 workers. That is 0.21% and 0.46% respectively (with 4 months left in the year). Absent a major change, those forecasts are fantastically accurate for 8 years out. The DWD forecast is off by 3.2%, which is not bad for a ten year forecast (it isn’t great though). Count this one as a huge win for the academic economists.
The problem however, that this was the published DWD forecast for 2014-2024, which they published in 2016. They got the damned history wrong (2014 and 2015). That is how bad their process of internally vetting this things had become. They got quantitatively verifiable history wrong.
But, the real problem is that they used bad data to forecast the demand for workers by education. They did so by using a very old data product from the BLS which ties typical entry level requirements to each occupation. In that data series, airline pilots had no post-secondary educational requirements. Neither did nuclear power reactor operators or detectives.
As a tool for effectively assessing actual market-based educational requirements, these data are nothing but trash. They’ve been updated as late as 2022, but remain suspect. Commercial pilots now are listed as requiring a bachelor’s degree, but their additional training is listed as moderate on-site training.1
The DWD still uses this trash data, which I view as the consequence of running off staff members who possess a fair to middling grasp of labor markets. My friends at BLS told me this data series exists because a ‘not too bright’ Member of Congress is convinced that we are over educating folks, and wished to demonstrate this.
The result is that Indiana’s DWD forecast occupation demand based on these data series. This mean’s they’ve estimated huge demand for folks without a any post secondary education, and trivial or declining demand for higher education.
I placed their forecasts beside the actual levels of education, by occupation as reported by the BLS in a different series. I also included a technology adjustment that altered the educational mix over the next ten years based upon the shift of the previous ten years. So, again, I used the DWD occupation forecast, but adjusted it for actual educational attainment in those occupations, and then an adjustment of change within these occupations toward more education in keeping with the history of educational attainment.

Forecasts are inevitably wrong, but are designed to be useful The DWD forecast is as bad an analytical product I’ve seen used for policy. It used data inputs that were inappropriate for projecting actual demand for labor. It combined that with a bad forecast of levels of employment. Together this vastly understated the demand for educated workers in Indiana.
When I mean vastly, I mean they were off by a combined 850,000 workers or so, at of a total growth of 200,000 workers. And yes, that’s right. They predicted that Indiana business wanted to actually “down skill” their existing labor force over the last decade. That alone should’ve raised warning bells within DWD. But, they didn’t have anyone with the analytical prowess to detect this, and when they were told by outside economists (from two universities) they ignored us.
The end result was that bad data, even worse analysis and puzzlingly incompetent policy development process ended up guiding our educational policy. It let to dramatic cuts for higher education and a policy shift away from preparing students for post-secondary education. It was a policy failure on a grand scale.
This isn’t a matter of disagreement among analysts, or a case of a modest technical error. They were repeatedly told they were wrong, and dismissed these concerns. This led to policies that can be described somewhere between brutally negligent to deeply immoral. I told the crowd that Indiana will feel the pain of this policy shift at least through the 2060 Census — if it is corrected now.
Indiana’s lagging educational attainment is a personal challenge to many young Hoosiers that will leave them less prosperous, and with fewer employment options than if we’d actually continued to invest in their human capital development. But, my real point is that it will clobber the Hoosier economy overall, not just a generation of shortchanged Hoosier students.
To illustrate this I showed them data about labor demand and supply nationwide. I started with growth following the end of the Great Recession. That is the year that today’s high school freshmen were born.
This is the cumulative employment growth, by educational attainment in the USA since 2009, the year the class of 2027 was born. I noted that in the life of their first year students, the USA has created more than 17 million new jobs for college graduates. For everyone else, the number is nearly a million total fewer jobs.

Indiana’s DWD influenced state policy away from the black line of growth. Sadly, this is affecting the composition of jobs in the state — since businesses have to work with what they have. Indiana is in the midst of job polarization, which is the death of the middle skilled jobs, and the birth of higher and low skilled employment.

The reason for this is that Indiana has an over-supply of poorly educated workers and an undersupply of workers with a BA or higher. This will cause Indiana’s personal income to decline even further, and for our growth to stay solidly lower than the nation as a whole.

I went on to show the grand paradox of rising college wage premium accompanied by growth in the share of college educated workers. This from Autor, Katz and Kearney. I hyped Dr. Kearney’s new book, which I will review here in the coming months.
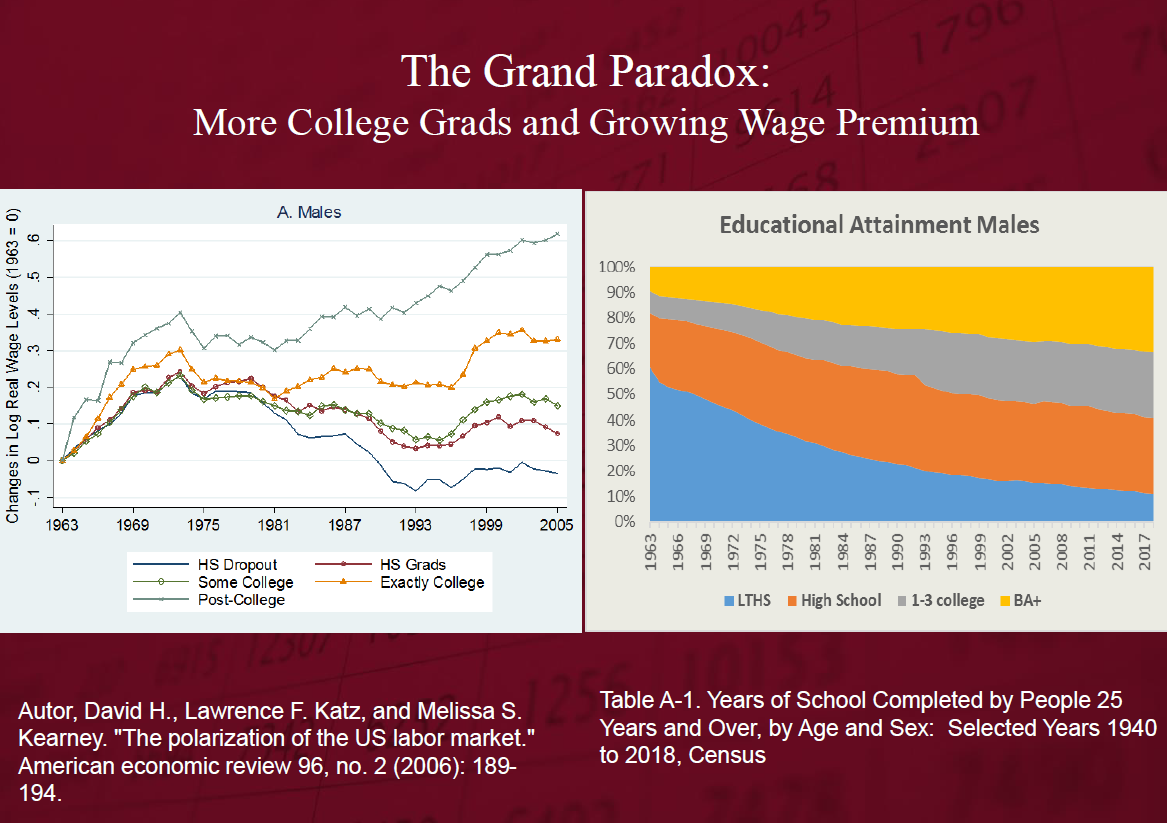
I noted that the college wage premium for Bachelor’s only was slipping in recent years, due primarily to wage growth concentrated among low wage workers during and after COVID. But, that the overall college wage premium (here comparing monthly salaries of BA or higher to high school graduates remained high and in aggregate, largely unchanged (these data from 2nd quartile wages from FRED).

I then showed this work from David Autor, that shows where the job losses are coming across the past five decades. I noted that these declines fit directly into the preponderance of the state’s dual-credit CTE courses.

My second graph from David Autor’s superb work illustrated the decline of these middle skill jobs across cities and rural areas.

My point is not that Indiana shouldn’t have a robust CTE curriculum. Indeed, Governor Pence made his public announcement of his CTE initiative at my forecasting event. My point is that his stated purpose was to create pathways for students who did not wish to go to college. I support that, with the caveat that we should wish every child to have choices at 18, and a school environment that made that so. However, Governor Pence’s vision of educational opportunities for everyone was badly executed (by the leadership of DWD and and through their data, the State Board of Education. That pushed students away from post-secondary education.
I made the point here that both the Daniels and Pence administration pushed for aspirational educational attainment goals. We are not longer doing that and it is weakening Indiana’s already slow growing economy.
Still, I wanted to make the point that education isn’t just about matching people with short term job openings, as seems to be the case in state policy. Educational attainment has broad benefits for people and the regions they are located in.
From my 2017 study, I showed the regional correlation between educational attainment and risk of automation related job losses. I noted that in my study and a follow on from Brookings pointed out that education reduced a region’s and individual’s risk of losing employment to automation.

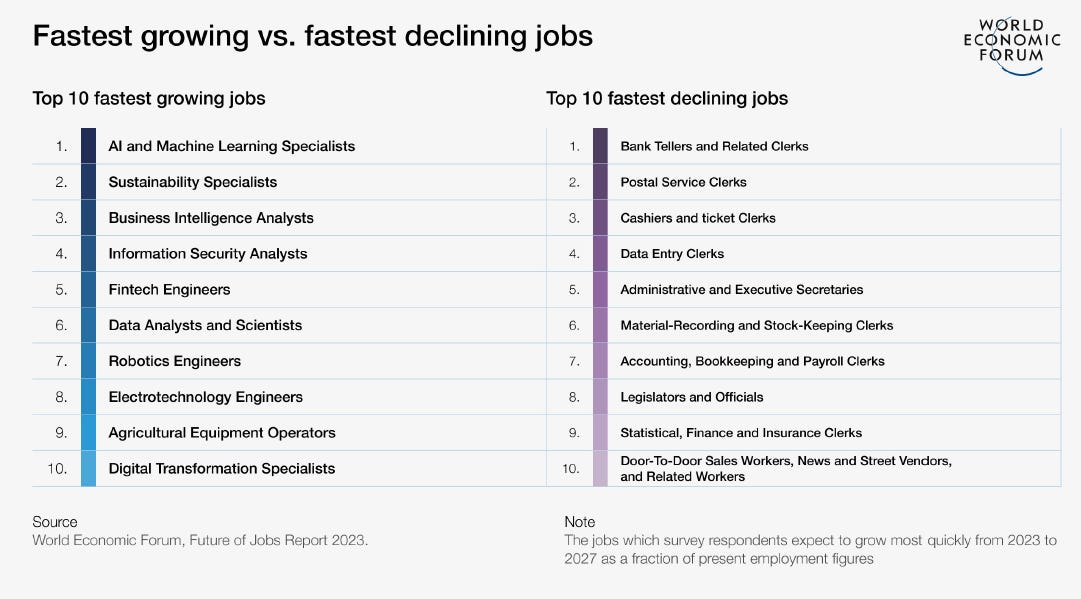
I also showed them data on Artificial Intelligence (AI) from a World Economic Forum study (I believe I misspoke and called this a McKinsey study). I pointed out here, that Artificial Intelligence, like all other previous technologies would normally act as a substitute for low skilled labor and a complement to high skilled labor. This is true for the wheel and plow as well as the robot and ChatGPT.
I ended my data presentation with an uncomfortable statistic which illustrates the role of School Boards in pushing for educational excellence. This is a graphic of the size of school corporations and the enrollment share of AP STEM courses (6 courses total, in Biology, Chemistry, and Calculus).

As is apparent, there is strong correlation between school size and the offerings of STEM that are available. I told the audience that it is a little secret among colleges that we all want kids to take AP courses and I’m sure Purdue even wants its English Majors to take Calculus. Advanced Placement courses are part of the acceptance measures by all schools, and are evidence of students and schools pushing excellence.
Clearly, offering these courses is expensive, which is why small school corporations are shortchanging students. Nearly 10% of school corporations offer none of these classes. In an educational environment that was aspirational this would not occur. In a school environment in which kids were prepared for careers, not just their first job, this would not happen.
In summary, I noted that Indiana’s college going and completion rate collapsed. In 2015 we were at 65.8% and declined last year to 52.9 percent. This is a loss of more 5,000 kids per year. If we could push another 12,000 kids to college each year and graduate half of them, we’d still be be a full 10 percent behind Mississippi, who is sending 81 percent of their kids to college.
I re-emphasized the folly of pushing kids away from college, which is currently part of the language of our gubernatorial campaign. I don’t think there’s a stigma associated with kids choosing non-college options. If so, that is silly. But, if we are telling kids that there’s abundant, well paying jobs that are long term career options for folks not going to college, we are misleading students and their families. That is just wrong.
I also told the ISBA attendees that the movement away from colleges will clobber the Hoosier economy. Indiana needs to stop focusing on ‘job readiness’ and educate students for the half century of work they face We need to return to the aspirational goals of education that Mitch Daniels and Mike Pence promoted.
Insofar as we should consider policies, it is good to remember that this is about public services, not about the wellbeing of teachers or professors. The pay issue is about having qualified people in these positions, which is a current and expanding problem for Indiana.
Educational reforms worked, and need to be sustained. Hoosier school boards should understand this, and work to be the school folks nearby choose for their kids. It is working well.
Finally, we are going to have to shift resources ($2-$2.5 Billion of state funding) to activities that show a high return on investment. This means early childhood education, solid literacy programs and supporting higher rates of college attendance. I implored school boards to talk to their elected leaders immediately and share this work with them.
I ended by saying Indiana needs to craft an educational environment that fosters college and careers, not CTE courses and a job. If we do not, we’ll pay a heavy price in growth and population loss in the decades to come.
Flight training for Army Warrant Officers is 12 to 18 months, depending upon the platform. That is about the quickest training to become a commercial pilot, and is probably the source of the roughly 5% of pilots without a Bachelor’s degree.
I'm going to show the chart of employment growth since 2000 by different levels of educational attainment to my first year college students. Hoping that will give them some ammunition if their friends back home tell them they are wasting their time and money by going to college.
Thank you for sharing. Where to start? This is infuriating on so many levels for those of us who live sleep eat breathe public education.
I’ll pick one... K12 employee wages. Holy mother meatballs. That Indiana has a billion dollar budget surplus and is content to allow this decline says something... something bad.
How much would it cost to close the gap? $5,641 - 4,413 = $1,228 × ??? That is, how many employees are we talking about?
And:
"I told the audience that it is a little secret among colleges that we all want kids to take AP courses and I’m sure Purdue even wants its English Majors to take Calculus."
Unfortunately, Purdue wants its English majors to disappear. But that’s a story for another day.