


Whither Michigan and Indiana
(answering Aaron Renn's Question about quality of life differences)

Michigan fancies itself an attractive place, with lots of amenities. That is true. But, it is also true for Indiana. However, amenities alone don’t make quality of life. As I have explained here, residents also value local public services. Quality of life is typically measured as the willingness of residents to pay additional for a home (unexplained housing values), or their willingness to accept lower wages for a in a particular place (unexplained wages). I wrote about the idea here, in more detail.
Michigan’s unweighted county level quality of life is a -0.13, or almost exactly a half standard deviation below the national average (zero). Indiana’s unweighted county level quality of life is -0.029, which is about 1/10th of a standard deviation below the national average. So, in pure quality of life terms, Indiana is roughly at the national average, while Michigan is well below.
However, over the past 40 years, the quality of life of the average Michigan county has never been greater than zero. Over the same 40 year period, Indiana’s steadily declined, and has been stuck at about zero for more than a decade.
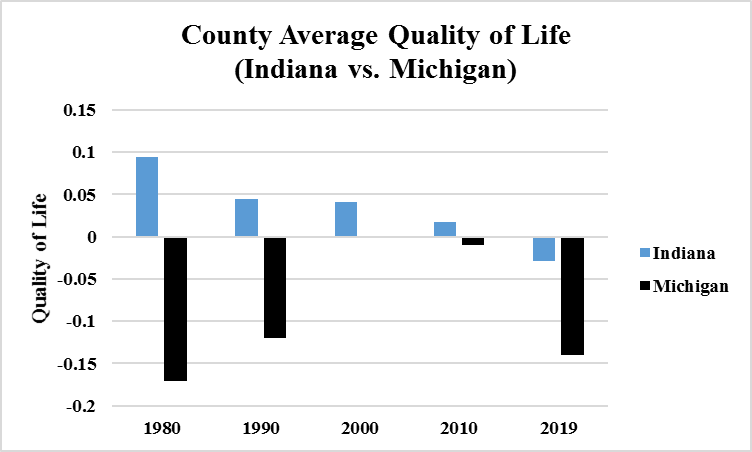
These data should really worry policymakers in both Michigan and Indiana. But, this surely explains some of the population dynamics over the past 40 years. Neither state is doing well at all, but Indiana is doing better.
Of course, regional economists view urban growth as caused by three important forces: quality of life, agglomeration and housing supply elasticity. The Census measured the vacancy rate in Indiana at 9.1% in 2021, and in Michigan 14.1%.1 So, both Indiana and Michigan are plagued with an oversupply of housing. While some cities might be experiencing housing markets that today feel tight, that is a relative thing. The problem in Indiana and Michigan is that housing oversupply and continued population decline makes new housing unprofitable.
That leaves us with agglomerations as a factor in explaining the difference between the two states. Using a Cobb-Douglas production function to measure agglomerations, which are really unexplained productivity differences attributable to density of economic activity. At the county average level, Michigan is slightly negative, Indiana’s slightly positive, but neither are statistically different from zero. So, that probably cannot explain the differences (and county GDP data begins in 2001, so I cannot go back further without a load of assumptions).
One intriguing measure that was used by Conroy and Watson (2023) is that the over/under supply of educated workers is a measure of quality of life. These authors combined this measure with measures of natural amenities to measure entrepreneurship. So, I tried something similar.
With colleagues Amanda Weinstein and Emily Wornell, I estimated the over/under supply of college graduates. in each US county. The county average for Indiana is 0.96% while Michigan’s is -0.51%. These the standard deviation is 5.8%, but these two values are statistically different from one another. But, the real issue is that 43% of Indiana counties have negative values, while 60% of Michigan counties do.
Combining these two measures makes it pretty clear that despite having some very amenity rich locations, Michigan is not doing well in quality of life. So, can that explain long term population differences? Yes, of course.
From 1980 to 2019, a one standard deviation increase in quality of life would cause population growth to increase by a bit more than 0.8 percent, or a bout 20% of growth or the average US county.
However, the effect on prosperity of quality of life measures are pretty profound. Let’s just take a pool at educational /over/undersupply in both states, and how they relate to new business starts. These two graphics illustrate how many more Indiana counties have an oversupply of college graduates than does Michigan.
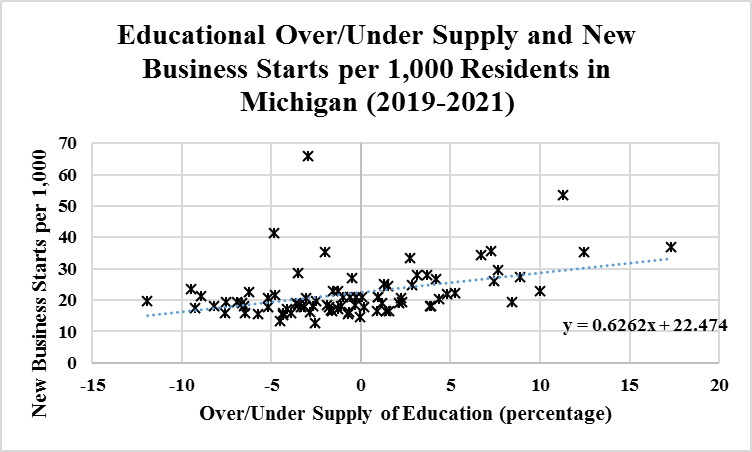

Just to be clear, Michigan has a higher share of its adults with a college degree or higher than does Indiana. It’s industrial structure is more heavily biased towards a better educated workforce. The over supply of educated workers isn’t a measure of human capital, it is a measure of quality of life. An over supply of educated workers implies that some share of the most mobile demographic are willing to locate in a county despite worse job prospects. That is how we measure quality of life. The graphics above indicate they are replacing poor job prospects with entrepreneurship.
Thus, Michigan is better educated than Indiana, but it has worse quality of life. However, neither Michigan nor Indiana are doing well on either measure. Indiana ranks 40th in adults with a BA, while Michigan is 34th (D.C. and Puerto Rico are includes in those estimates).
Indiana is in long term decline in quality of life, and has turned the corner on improving educational attainment. The Hoosier state is beginning a long decline. Michigan remains weak in both, but that doesn’t really explain the fullness of the differing economic outlook for both states.
I think it really comes down to urban success. Yes, urban success depends upon quality of life, education and agglomerations. Indiana has Indianapolis, MSA, which continues to thrive. Employment growth this century, within the Indianapolis, MSA is 273k jobs, while outside the state lost 35k jobs.

Thus far this century, Detroit lost 57K jobs, and the rest of the state lost 182k jobs.

The differences between Indiana and Michigan’s economic success really comes down to a tale of two cities. Indiana’s major urban center is healthy and vibrant. Michigan’s is not.
https://www.census.gov/content/dam/Census/library/publications/2022/demo/h121-22-01.pdf
I’m in the middle of Vaclav Smil’s ‘Numbers don’t lie,’ and he views infant mortality as the single best QoL indicator because of the number of complex interrelated causes. It’d be interesting to see how that aligns with your metrics, as I know some zip codes in Indiana have higher infant mortality than Sierra Leone.