Judging the Value and Quality of Public Services
Families and Businesses can judge value of public services as well as tax rates.
A surprising share of state and local government efforts are directed at some type of economic development. This goes by different names, from traditional business attraction, to community development to ‘attracting and retaining talent.’ Whatever the name or tools used, it largely means trying increase the number of people and employers in a county or city.
Technical analysis of why people and businesses choose particular locations is common in geography, sociology and especially economics. This question has preoccupied me for most of the past quarter century.
There are plenty of good reviews of the matter. I am partial to this one and here. There’s also interesting work on local area determinants here and some of my work on why much of what is traditionally done in economic development hasn’t worked here. I’m coauthor of this piece that focuses on the Midwest. Let me summarize these a bit, and put it all in policy context.
The reason people and businesses choose a location changes over time. When transportation costs were high in the 19th century they moved near resources to produce goods. When people consumed mostly goods, the natural resources and supply routes — rivers and ports, later trains and roads — really mattered.
As people began to consume more services, the clustering of factories began to hold less promise for economic activity. Midwestern manufacturing employment peaked in roughly 1970. We are now a half century and a 100 million new jobs in other sectors away from peak factory employment in the Midwest.
The technology shifts of the last quarter of the 20th century, means a growing reliance on formal education, flexible skills and technological adaptation. The jargon for this is skill-biased technological change. That demand continues to grow. As evidence, the U.S. has not created a single net new job for anyone who has not been to college in three decades. There’s no reason to suppose that will ever change, much less in the coming century.
Formal education is expensive, and has lots of regional spillovers. It is beneficial for an individual and their family to pursue an education, but if they do not, it’s best to live near educated people. That’s where pay is best and opportunity abundant.
Among the new technologies of the late 20th century are those that reveal regional differences in the quality of local public services — education, public safety, and health. Unlike the 1970’s, families can now click on the internet and observe the stark differences in health, school quality and educational attainment in cities and counties. All of this narrative supports a simple observation about the location of businesses and households.
Families move to places with good schools, low crime, and good healthcare outcomes. Businesses move to places where people locate. In my research, I call this pursuit of these places as seeking ‘quality of life.’ In that research, my colleagues and I find that other things matter also, like nice weather and recreational opportunity. But, make no mistake — the quality of local public services matters more than everything else combined.
These households and businesses making these decisions are highly sophisticated economic agents. They are far more informed and wiser than the economic development groups or municipal leaders who try to lure them with incentives and marketing campaigns. One way to judge how bad many of the efforts to lure people and businesses have become is simply to examine data about location and taxes.
Perhaps the most common claim is that low taxes are an economic development advantage. That is familiar, sounds reasonable and has lots of adherents in government and business. It has only one weakness — it is wrong. While there are certainly individuals who move due to low tax rates, the aggregate effect is quite the opposite.
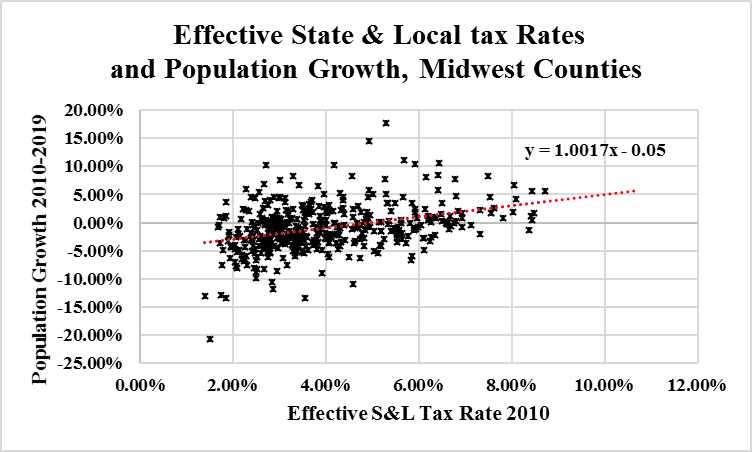
The correlation between economic growth and tax rates is not negative, as low tax advocates argue. It is positive. All the fast growing places (counties or metro places) in every state have higher tax rates than the slow going places. For example, in Texas, which counts itself as the low tax state, nearly all the population and economic growth is happening in a dozen very high tax places. The same is true in every state. This graphic depicts the Midwestern counties from 2010-2019.
How can this be, do people like taxes?
Of course not. But, being sophisticated economic agents, businesses and households care about value, not price. I’m always astonished to hear elected officials and economic developers speak of families and business owners as if they are one dimensional caricatures, capable only of seeing a tax spreadsheet, yet unable to judge the quality of public services. That may have been more true in the lower information environment that preceded the internet. It is not today.
That is however, precisely how they are treated. They are treated this way in political speeches and committee hearings. I think it would be a public service to treat families and business owners with a bit more respect. One way to do that might be to compare tax rates with measures of government quality. After all, sophisticated economic agents, like businesses and households judge quality and price. We even have a fancy word for it — value.
So, how can we think about the quality of public services and the price?
The price is easy, it is the effective state and local tax rates. I’ll use those from the Tax Foundation, but most estimates are the same. I’ll focus on states, but local data is also useful. And, I’ll skip a deep technical study on this, and go right for the raw correlations. This has some minor imperfections, which I will note.
The use of raw correlations has one important imperfection, which I should deal with at the outset. In a good technical study, when controlling for many different factors (variables) that would influence migration, or economic performance and taxes, you are apt to find taxes matter. All things being equal, we wish to pay lower taxes. But, the effect is small, and at the margin. So, large differences between places are not remediated by cutting taxes.
In other words, taxes only matter, when all else is equal. As the graphics below display, the variation in government quality displays gross variation. Crime, premature deaths from disease, income or earnings, risk of highway or fire deaths, or education outcomes vary profoundly. More on that at issue later.
As I am about to illustrate, places that collect more taxes provide better public goods and services. Thus, places with higher tax rates tend to do better at those public services that modern households and businesses prefer. That is why the graphic above shows high tax places growing more quickly than low tax places. It is pretty much that simple.
A more difficult question is how to measure government service quality or efficiency. If you are really interested in the local angle on this, you can buy my book on Local Government Consolidation with Dagney Faulk.
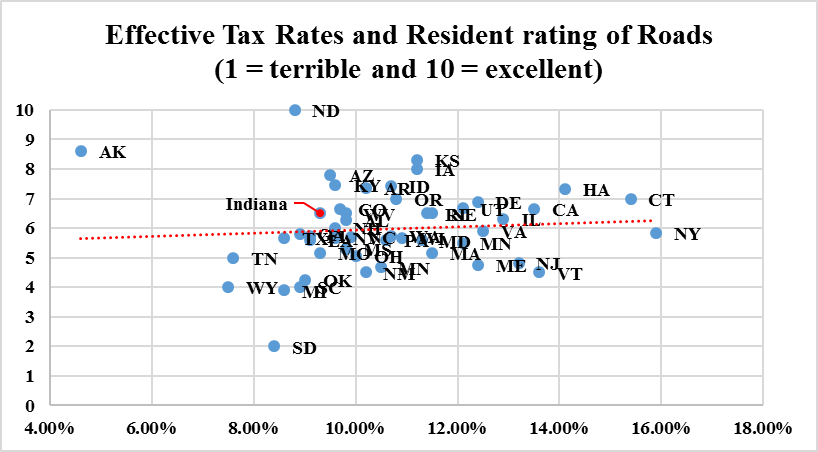
A simple method is simply to look at outcomes. Government affects educational attainment, public safety and health, and road quality. Let me take them in order. But first, a quick explanation of the graphics.
In our book, we focused a great deal on government efficiency. Our book is a technical study. A rough and ready way to measure efficiency is to observe when a state’s taxpayers get what they are paying for. There does not exist a single best way to measure government efficiency. But, we can measure average efficiency.
In each of the following graphics, the red ‘trend’ or regression line is the average efficiency. In the graphic below, states that lie on the red dotted regression line have the ‘expected’ share of college graduates for that level of taxation. In other words, their efficiency at delivering these services is ‘average’ for that level of taxation. States that lie above that line (like Massachusetts) are doing better. State that lie below (like West Virginia) are doing worse.
Again, this is not a technical study, that would control for lots of factors, most especially the per student spending (not overall taxes). Still, when taken together, these graphics make the point that higher taxes yield better ‘quality’ outcomes for states. There is variation, yes, but all in all, places that spend more of their incomes on government services enjoy more and better government services. Some do it very efficiently, others very inefficiently. Efficiency matters, because it affects the value proposition households make to live there (and thus business location decisions).
Still, as these data make clear, spending is driving quality and quantity of public services. And, almost nothing matters as much as education.
Here I present data from the Census that is available from lots of places. As is apparent, there’s a strong correlation between tax rates and education (here the share of adults who have graduated college). This correlation holds across many other measures, but this is the most common, and I think most appropriate measure. A full 81% of all the net job growth in the USA over the past 30 years has gone to college grads. This quality measure is thus an important link to economic performance.
Indiana, shown in red, both ranks low and is underperforming the place it should be (the ‘average’ regression line also shown in red). These are recent data, and do not yet capture the collapse in collage attendance rates that has afflicted the state, and which I wrote about here. Indiana will feel that over the rest of the decade and beyond.
Moving on to policing, we find that Indiana’s public safety performance is a bit better, but still will be surprising to many Hoosiers.
Indiana has a lower crime rate for both violent and non-violent crimes than we would expect at our current effective tax rate. That is good. However, our violent crime rate is roughly the same as NY’s (modestly worse), but our non-violent crime rate is much worse. The source data are from the FBI’s uniform crime report.
Again, this isn’t a technical study on the issue. There are many studies of contributions to regional variation in crime, here, and a monstrously long book here, and a shorter study here. Nonetheless, it is a safe technical assumption that policing funding plays a role in crime rates. It is an even safer assumption that people and businesses prefer places with less crime (which my co-authors and I report in our study of Quality of Life).
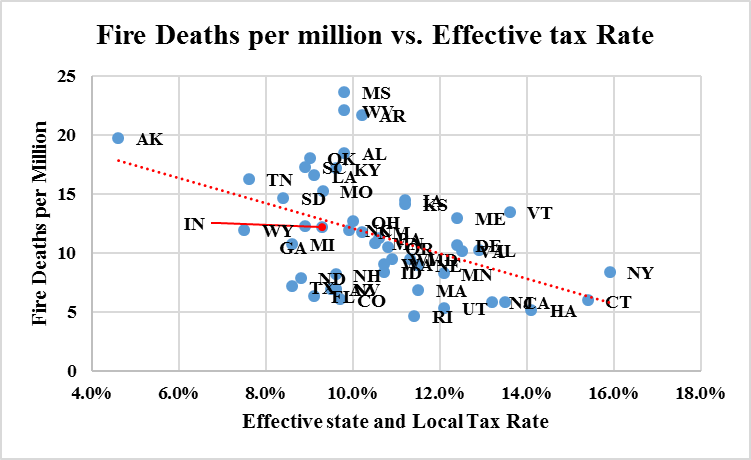
Other measures of public safety would include fire deaths.
Here Indiana performs about as expected with our relatively low effective tax rates. We are right about at the national ‘average efficiency’ in our delivery of fire safety for the overall tax burden. However, as with the other measures, larger spending fire safety would reduce fire deaths. That’s a similar story to road safety, which is both a public service (enforcement, snow removal, etc.) and a public good (road conditions, safety signals, etc.). Data on these deaths, and the other health measures are available at the CDC and at many data sites.
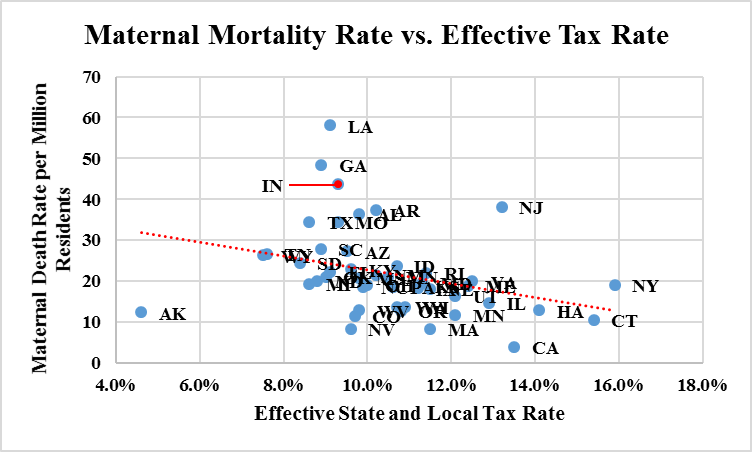
Maternal mortality is a public health measure. Here Indiana is appallingly bad, both for the level of taxes we collect and for the overall measure. This is also a good example of the limits of a simple correlation. Indiana has underlying demographic issues that increase risk of maternal mortality (Amish residents). However, that alone wouldn’t make this a good story, just a modestly less dismal one.
I choose this one not so much as a measure of poor quality public services, but as an insight into the growing realization that Indiana has a problem with public service quality. Governor Holcomb, whom I judge as one of the most important Governors in the country on public health measures, has made improving our maternal and infant mortality rate during his term in office.
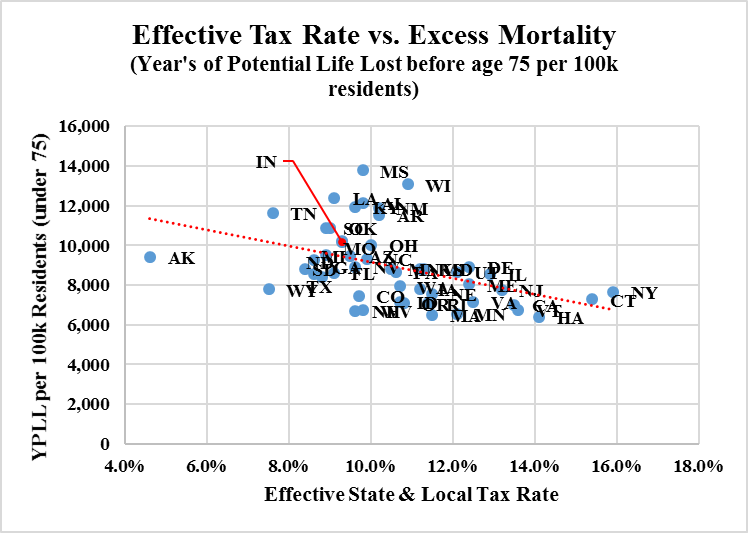
A better measure, that tells an unhappy story is that of overall excess mortality. This is typically measured as the years of potential life lost before age 75 per 100,000 residents. This is a representation of “all source” early death, across the many different measures they report. As with the other measures, this comes from the CDC, but is available elsewhere such as here, as a more accessible form.
Indiana does poorly on this, with higher loss of life than would be expected at our current tax rate. As Gabriel Bosslet argues here, is a broad problem in Indiana. Public health is a multi-dimensional, and key public service. Finally, I move on to public goods. The easiest to measure, is roads. Here I use this site, which reports a resident survey. This is rare, most other data sites use road quality measures of roughness, etc.
Indiana outperforms here, with residents ranking us slightly above where we’d be expected to be at our effective tax rate (the red line). I note that this is a recent survey, and the quality of Hoosier roads was recently so bad that the General Assembly raised road taxes (gasoline tax), imposed EV fees and shifted the sales tax on gasoline from the general to road funds. I wrote about the problem here, noting its connection to state and local taxation.
These data suggest a clear connection between tax rates and the quality or quantity of local public services. I think that this linkage is well made in the academic literature and should be conceptually available to anyone thinking hard about the issue.
I think it is hard to overstate how widespread the belief that low taxes incent economic activity actually is. I think most lawmakers, including many smart ones from both parties believe that low taxation is a key factor in business and household location decisions. Part of the reason for this widespread error is that until relatively recently, that was likely the case.
I believe that the explosion of interest in public service quality is not new, but our ability to access truthful information about public service quality has been through a revolution. Now Americans can readily know the high school test scores for college, the proximity of registered sex offenders, the number of potholes in a city, and the level of air quality.
At the same time, we are a wealthier society that values these attributes more heavily. This is particularly true among geographically mobile, college educated workers who are most likely to migrate. To put it in economics jargon, quality of life and effective government services are ‘normal goods.’ That means we consume more of them as our income rises. Some of these might actually meet the definition of luxury goods, in which we consume a rising share of our income on them as we become wealthier.
I’ll not undertake a formal proof of these issues (I’m currently working on a book length treatment of Quality of Life). I’m just suggesting that there are plenty of smart folks who under estimate the role of public services and over estimate the role of tax rates. That’s the point of this column.
I also think there’s growing evidence that some combination of factors does mean that the quality of public services outranks taxes in family (and thus business) location decisions. One way to judge this is simply to use Google Trends data on searches. Here we have the “interest over time” data, where low interest is (0) and high interest is 100). Here I use the 12 month moving average, which seasonally adjusts the rankings. I asked five ‘local service quality’ questions, a ‘remote work’ question and low tax places.
I didn’t game the questions, if there are too few rankings, Google doesn’t report data. If you ask a question with close substitutes, Google provides other types of offers. Safe Neighborhoods and Low Tax Places were the highest ranked of questions phrased like the quality of life questions (.e.g ‘best schools near me’).
As you can see, public safety questions mattered throughout the sample period (Jan 1, 2004 to Dec 20, 2022). Taxes and addiction treatment both mattered early, while the past few years have seen an explosion of school, trails, parks searches. Remote work started to separate in the middle of the last decade, but not surprisingly exploded post-COVID.
My argument here is simple.
Households increasingly value public service quality, and appear willing to pay more for better quality local services. Business go to where people are, either as customers or employees. This simple dynamic explains why higher tax places are seeing more population growth. So, if you wish to see people and businesses move to your community, a myopic view of tax rates will be counter-productive. It is better to view taxes as the price of public services, which changes the conversation away from reducing taxes to one focusing on value.
I simply propose we change the debate from cutting taxes to providing high value public services to attract people and businesses. But, I have one more piece of evidence to make that argument. It comes in the form of measuring the relative differences between states across taxes and service quality.
As it turns out, the differences between states in their effective tax rates exhibits less variation than does the quality of public services. Yes, states collect taxes very differently, but when it is all said and done, the differences in effective tax rates are small. In contrast, state to state variation in public service quality is huge.
Here I report the Coefficient of Variation (the standard deviation divided by the mean) for taxes and public services. I ranked them from lowest to highest, and it is apparent that taxes show low state to state variation, while other public service quality measures show a great deal of differences.
The take away from this is that if you wish to move up the rankings, it is far easier to do so in say, crime, graduate school degrees, or fire deaths than it is to move up the tax rankings. And, to be clear, I’m not sure improving something like ‘maternal mortality’ will lead to an explosion of new economic activity in a state. Rather, I argue simply that this is a measure of overall public service quality. If you have high maternal mortality rates, you probably are doing poorly on all the other measures as well.
It is a well accepted fact these public service quality measures mostly all vary together. Just a quick examination of the Correlation Coefficient makes this clear.
This table illustrates the correlation between the variables I list above. As you can see, these variables are nearly all correlated with one another. Take education for example. The correlation between higher effective tax rates and educational attainment is positive and high (0.56, when 1.00 is a perfect relationship, and 0, no relationship). That relationship is shown in the first column.
In the second column, we see how the percent holding a BA or higher relates to all the other variables. Everything except roads (which are public goods) are correlated here. One interpretation of this is simply that there is no such thing as a ‘crime’ or ‘public health’ or ‘education’ problem. They are all the same phenomenon of differences in human capital simply manifesting themselves in different outcomes.
Finally, nothing in this little essay is new. Economists and other policy researchers have understood for a long time that state and local public service quality plays a key role in economic growth. That is why high tax places grow, while low tax places largely languish. This has policy implications, but they are nuanced.
First, if you are a state with low quality public services and low taxes, you might be advised to shift substantially more revenue into improving those public services. Low taxes won’t yield population or economic growth High quality public services will promote economic and population growth.
Second, this is not a call for copious, poorly considered spending. Efficient delivery of public services is also important. That means school choice, competitive healthcare markets, many different pathways to college and other post-secondary education. Policies that tie together education with public health, and those which promote college early, especially to poor citizens are likely to be more successful.
I appreciate that there is much to digest in this essay. It took me years to fully understand it myself, and try to explain it within the context of tax and spending policy. What is now clear to me is simply that the model of low taxes fueling business expansion no longer works. Even if at one time it was a contributor to economic growth (and the evidence on that is mixed), it has not mattered for at least a quarter century or longer.
Places that provide high quality public services will thrive. It would be better if they could do this efficiently, keeping the cost of public services relatively low. But, that appears to take a back seat to simply providing high quality services. In the current environment and the coming decades, I think one thing is certain. It is better to risk over-taxing and over-producing high quality public services than it is under-tax and under-produce those services.







Another thought-provoking analysis. These challanges won't be addressed by chasing low value-added manufacturing jobs, creating more TIF districts, or tax rebates. I hope our legislative leaders are listening.