
The Persistence of COVID Learning Loss
We aren't seeing broad recovery

In December, my colleagues and I at the Center for Business and Economic Research published an updated COVID learning loss study of Indiana’s schools. This will be of interest to Hoosiers, but Indiana is a pretty good national case study for this issue. The state has relatively large urban and suburban schools, mid sized and tiny rural and small town schools, and significant demographic variation.
Most importantly, Indiana had huge variation in COVID restrictions, since these decisions were local. Some school corporations (districts for folks outside of Indiana) were fully remote, while others attended full time with no interruptions. Most did some mix depending on local COVID conditions. Most importantly, this was reported to the state, which provided researchers the chance to test the hypothesis that learning mode affected outcomes.
Indiana’s Department of Education has reported (or contracted for) learning loss studies that were comparisons of summary statistics about learning loss; here and here. These are useful in understanding the magnitude of the problem, but not its source. The work my colleagues and I did tried to do both; describe the size and source of the problem.
At issue is what are the causes (or at least correlates) of learning loss. The summary statistics cannot approach this problem effectively. For example, one of the studies above separated students by race, and reported pretty alarming differences. But, failing to control for other factors means that we cannot tell if race (instead of say, poverty or learning modality) were to blame for learning loss. Our studies remedy that shortfall.
I begin by just noting the ILEARN pass rate by year, going back to 2019. Indiana introduced a new test the year before, which isn’t really comparable to the current test, so without some test normalizing, going back earlier isn’t that helpful.

As is clear, there was a big drop in performance from 2019 to 2021. The 2022 scores improved a bit, but the 2022 to 2023 improvements were mixed.

This result hold across age cohorts. Here we have three cohorts, whose performance plummeted across COVID.

Part of this decline might simply be that middle school outcomes tend to be worse for everyone. We call this an artifact of testing, but it is when student performance variance tends to be large. For example, some kids take Algebra I in 7th grade and take the End of Course Evaluation. Algebra I is a high school course, so there are larger differences in educational content in middle school, that did not materialize earlier. That, for example would explain at least part of the youngest cohort doing better in 5th grade (in 2021). Sadly, they converged to older cohorts by 7th grade.
We also noted that some of the learning loss in these test scores might be a residual of instructional strategy focusing on long term learning.
“. . . instructional strategies may emphasize long-term recovery from learning loss at the expense of learning strategies that focus primarily on current grade level knowledge. If effective, these strategies may result in strong recovery of learning deficits due to COVID, but it is too early to observe them in these data. The implementation of these strategies is likely very heterogeneous across schools and students, and is not visible in our data.” (page 3).
If schools are focusing on longer term learning outcomes, at the expense of the next ILEARN test, we might see strong recovery over time. This is probably too hopeful, but time will tell if this is the strategy in place.
The bottom line is simply that the current rates of improvement suggest that learning loss across COVID is significant and shows little sign of full recovery.
The next question, which is relevant to a number of mitigation strategies, is simply what factors contribute to that learning loss. Is is instructional mode, such as hybrid, fully remote or fully in person? Is it school size, the share of students in special education or English Language Learners (non-native English speaking student)? Is it change in enrollment (students leaving for other schools)? Is it demographics or poverty?
To test these we ran several dozen empirical models of learning loss that we’d used in our earlier study. We ran learning loss from 2021 to 2022 and again from 2022 to 2023. Importantly, in these types of analysis one would normally expect a lot of statistical error. For our purposes, we are mostly worried about Type I error, where we would find a variable statistically significant when it is not. Type II error also occurs, but we are less worried about that because of repeated testing of the same question across multiple grades.
Our approach to this problem is to apply some judgement to our results. With 6 grades, tested on English, Mathematics and both tests, we anticipate a great deal of randomness. We are interested in considering variables that appear frequently across all our tests, not those that appear only occasionally.
A second matter, that I discussed above, is the value of this approach in controlling for multiple variables simultaneously. This stands in contrast to the summary statistics approach that cannot isolate or control for different potential causes.
Our first model is learning loss after COVID. Our earlier studies did the pre-COVID analysis.

The three big factors are poverty (share of students qualifying for Free or Reduced Lunch), the 2019 Pass Rate (pre-COVID) and the learning loss over COVID. Nothing else was reliably important in determining change in test scores. So, schools that were poorer, did better pre-COVID 2019 and had higher learning loss in 2019-2021 all had lower test score changes in both periods.
Same general story in Mathematics tests.
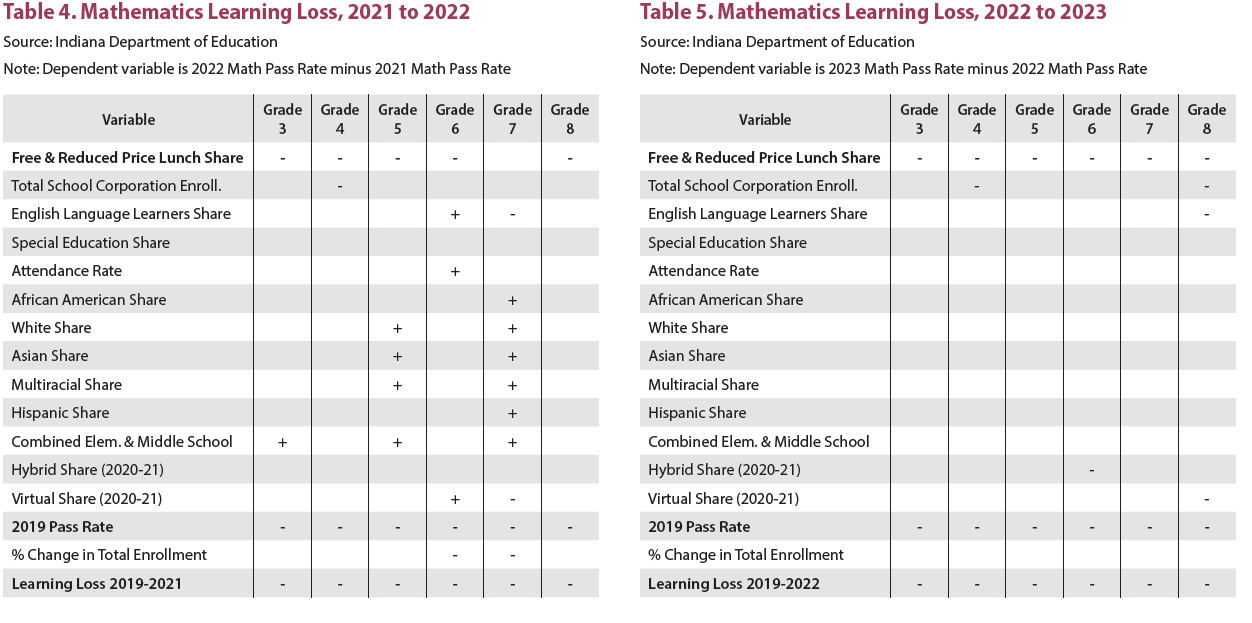
Same basic story for ‘both’ test pass rates. The story here is primarily that of poverty. The poorer the student body, the worse the learning loss. Demographics, learning style, presence of ELL or special education students didn’t consistently matter at all.

In order to dig a bit deeper, we also did an outlier analysis, comparing the average change with the top 25 and bottom 25 performing schools. There just isn’t any meaningful differences here.

We also wanted to discuss the magnitude of the effects. So, we calculated the ‘marginal effect’ of a one standard deviation change in each variable on learning loss. Those in bold were broadly statistically significant.

The challenge in addressing this is non-trivial. Forces that are likely outside the control of educators drive much of this learning loss. High poverty rates, how you did in pre-COVID tests and how bad learning loss was over COVID are all driving current improvements.
This diagram illustrates the pathways of outcomes. It also illustrates the ‘stickiness’ of post-COVID declines. Of the 1,372 elementary and middle schools we examines, only 16 improved each year. That is 1.2%. In contrast, 10.1 percent of schools experienced declining test scores for each of the post-COVID periods.

There are some interesting findings. The fact that pre-COVID test scores are, all things equal, negatively correlated with post-COVID learning loss suggests that there are obvious school ‘value added’ elements to student performance.
The reason for this should be pretty clear. Better performing schools saw more learning loss post COVID. If learning loss was solely a function of poorer families, then pulling students from the classroom would’ve hurt those families more. However, the bigger losses came from better performing schools (holding everything else equal). That runs counter to intuition, and the received wisdom that richer, better educated parents, from better school corporations would better help their children do well over COVID. On the margin, that seems not to have been the case.
What we didn’t find is also important. Instructional mode just didn’t play a role in outcomes. This is despite a very wide set of different approaches across a state with 290 School Corporations.
In the end, the big factor in learning seems to be poverty, how big the bounce back would be (2019-2022 learning loss) and how well the school performed on these tests pre-COVID.
The CARES Act and ARC Act offered substantial funds to remediate learning loss in schools. With few schools having recovered from COVID (far fewer than 10%), these programs appear to have been too lightly used by Indiana’s School Corporations. That is a pity, because the long term effects of this learning loss shock (and the associated declines in college attendance) will likely plague Indiana’s economy for a half century.