


Reality Check on ALEC's Rich State, Poor State . . .

Among the more influential economic narratives in recent decades has been a publication by the American Legislative Exchange Council (ALEC) publication entitled Rich States, Poor States. That work is now in its 15th Edition, and is authored by Arthur Laffer, Stephen Moore and Jonathan Williams.
This document is a ranking of states across 15 policy variables. The original (2007 edition) listed the following policy variables:
Highest marginal personal income tax rate
Highest marginal corporate income tax rate
Progressivity of the personal income tax system
Property tax burden
Sales tax burden
Tax burden from all remaining taxes
Estate tax/Inheritance tax (Yes or No)
Recent Tax Policy Changes 2005-06
Debt service as share of tax revenue
Public employees per 10,000 residents
Quality of state legal system
State minimum wage
Workers’ Compensation costs
Right-to-work state (Yes or No)
Tax/Expenditure Limit
Education Freedom Index
The index is transparent in method and data, and provides a great deal of narrative. The index is designed to generate policy change, and in the 2022 (15th Edition) the authors make clear what the purpose of the ranking is for:
“The Economic Outlook Ranking is a forecast based on a state’s current standing in 15 state policy variables. Each of these factors is influenced directly by state lawmakers through the legislative process. Generally speaking, states that spend less — especially on income transfer programs — and states that tax less — particularly on productive activities such as working or investing — experience higher growth rates than states that tax and spend more.” Page 1, 15th Edition.
The index has changed modestly over the years, the Quality of the State Legal System was renamed to the State Liability System Survey, and the Education Freedom Index was dropped.
Before I begin to review the effects of this Rich States, Poor States rankings, I need to be transparent about the research I’ve done on these issues. I’ve written on Right to Work, concluding it played a modest role in employment change in the last decades of the 20th century. I’ve written on Workers Compensation in West Virginia, concluding it was not a hindrance to economic growth (mostly due to mis-measurement of state level differences). I’ve written on property taxes, and spending limits (tax caps), local government consolidation, tax incentives, tax reform at a conference headlining Art Laffer, tax simplicity, tax burdens, sales taxes, more tax incentives and legal environment. Stephen Moore even highlighted my tax incentive research in the Wall Street Journal.
My research in these areas, broadly summarized, concludes states should be mindful of all these issues. I’m sympathetic to efficiency in government, and think some of the narratives in the Rich State, Poor States appropriately resonate with elected leaders. In particular, I like chapter 2 in the 8th edition, which rightly criticizes crony capitalism.
But, there’s just nothing in the economic growth literature, research on migration or population dynamics or business location decisions that would suggest these factors play a critical role in prosperity — however it is measured. The author’s cite some interesting work, but year after year, the peer reviewed studies they cite don’t point make these claims. In fact, about the only theory proposed is the Laffer Curve argument — which argues briefly that tax rate reductions can increase revenue, presumably through migration of business.
The problem with that argument in this context is that estimates of the Laffer Curve suggest national tax rates are well below the revenue maximizing level. State taxes are uniformly a fraction of federal taxes, so even taking the Laffer Curve seriously wouldn’t account for growth effects.
Even more damaging to the theoretical argument about location decisions and taxation are two facts about state and local taxes. The first is that state and local taxes affect the provision of local public goods (e.g. schools, public safety, etc.). There’s an abundance of research suggesting the quality of local public goods affects location decisions, including this little gem on quality of life.
The second is that state and local taxes are heavily subsidized, or at least were until the TCJA. Together, there’s reason to be deeply suspicious of the efficacy of the Rich State, Poor State argument. Still, this discussion should best be remanded to empirics.
Let’s see how the Rich States, Poor States ranking predicts prosperity in states. As a benchmark, we’ll compare the RSPS rankings alongside a competing theory — that educational attainment is a causal factor in growth. We begin with Gross Domestic Product. As a reminder, the Rich State, Poor State Rankins are ranked from #1 (best) to #50 worst. I use different time periods here not to confuse, but to illustrate the repeated nature of the findings.


Neither the Rich State, Poor State rankings nor educational attainment explain much of the real change in GDP in the post-recession But, educational attainment explains about twice the variation in GDP growth between states that the RSPS rankings do. How about increase in personal income?


Here it is not even close. The RSPS rankings explains about 2.4% of differences in personal income growth between states, while per capita personal income is explained by change in educational attainment explains roughly 20%. The Rich States Poor States measure explains less than 1% in the variation between states, while educational attainment explains 68 percent.
There is no effect of Rich States, Poor States on net migration of Americans between states.
When it comes to the most tangible measure of economic wellbeing in regions, the RSPS ranking just doesn’t explain enough to matter, while educational attainment explains nearly all change.
These levels vs. growth measures are interesting, but how do states that change their RSPS perform versus those who remained static, or worsened their scores? We have here data from 2007 to 2021 (except for net migration). We can look at income, GDP and net migration over this time period, versus the change in ranking on the RSPS index.
Recall, that the lower the ranking, the more improved the state. So, states that have a positive number dropped in the ranking, while those who have a negative number are doing better.
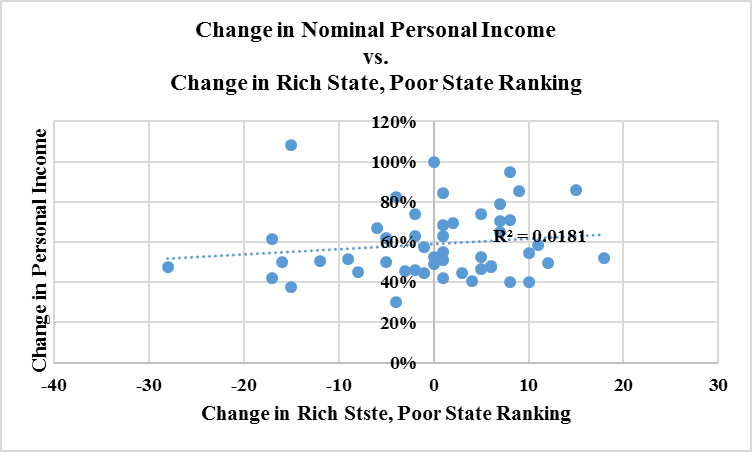
When it comes to personal income (nominal this time), states that worsened their ranking did better. It’s a terribly modest effect, that I’d interpret as ‘no effect'.’ Still, that means the RSPS ranking is meaningless on this metric.

That’s the same interpretation with GDP change. Improving your RSPS index has either a modest negative effect, or no effect (my interpretation).
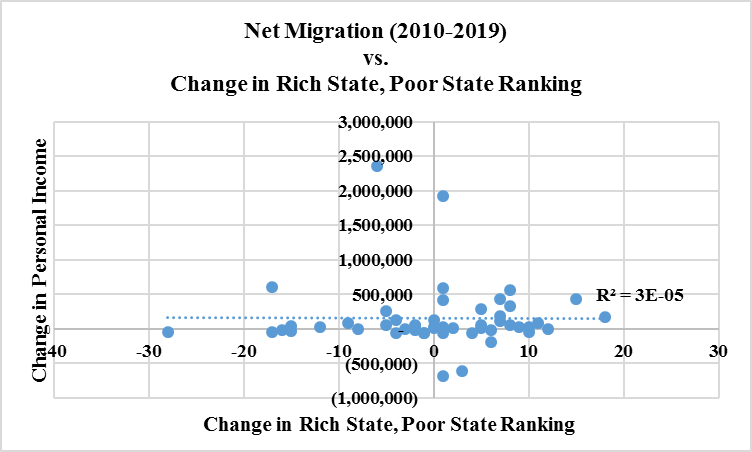
Same with net migration. Improving your Rich State, Poor State score does nothing for net migration.
There’s just no way to sugarcoat the interpretation of any of these data. These are naively simple comparisons that don’t get better with more analytical techniques. Whether we compare starting RSPS rankings to subsequent growth in incomes, GDP or net migration, or whether we compare change over a decade and a half with the same metrics, RSPS rankings just don’t offer any explanation for prosperity or growth.
Now, there are 15 measures from RSPS, and another several hundred measures of prosperity. I’m not trying to write a book here, so kept it simple. If you’d like to understand the depth of work analyzing this, read my CATO Journal article on Right to Work linked above. It is a good example of how to do incremental analysis of one policy when there are causal inference challenges.
I’m not the first one to call into question the results of the Rich States, Poor States work. The folks at Grading the States have done a modest piece here. They looked at income and poverty rates, using the 20 best and worst comparisons.
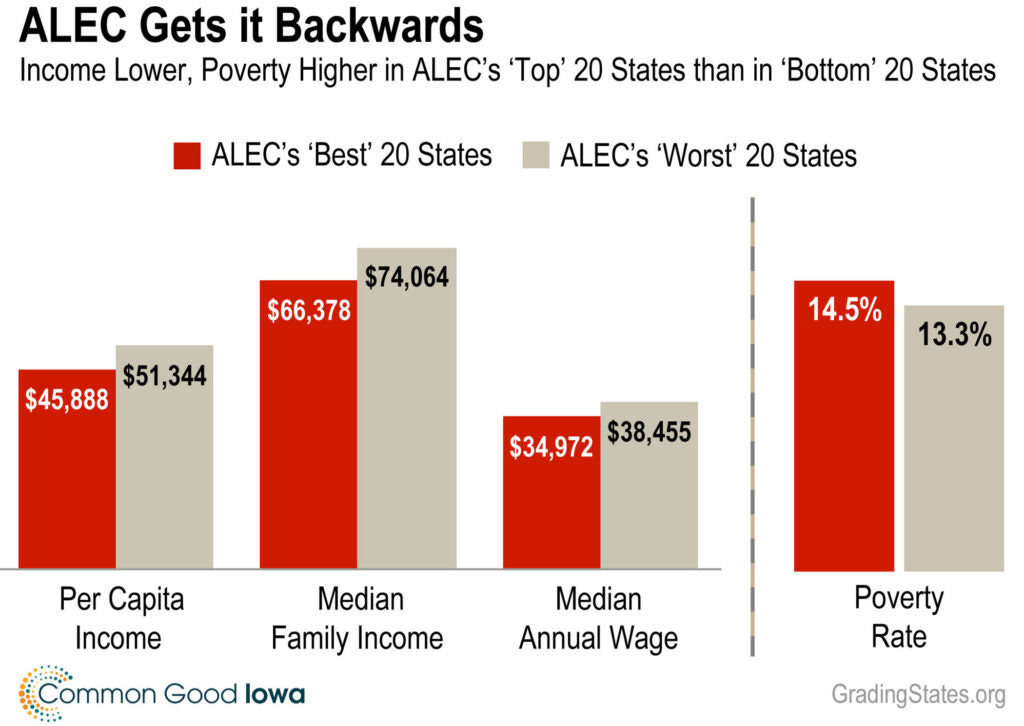
I think there is almost no way to slice the data and provide a happy story to the Rich States, Poor States grades. The only area in which the ‘good’ states perform better than the ‘bad’ states is in job creation. I don’t think growth in lower wage jobs is really the robust argument for RSPS its authors believe it is.
As I conclude, I want to reiterate that I am sympathetic to the issues offered in the RSPS work. Crony capitalism is misguided and ineffective, and state and local governments ought to be mindful of the cost of providing high quality public services. But, what RSPS misses in its entirety is the importance of quality public services, and the recognition that households and businesses appear to be increasingly motivated to seek out places with high quality public services.
For legislators wishing to craft policies that help their state grow, the Rich State, Poor State guide is a uniquely poor model to adopt.
Note: This post was updated to correct a couple typo’s and more clearly present the education/personal income relationship in the graphic and text.
Another powerful article by Dr. Hicks. Should be widely distributed.
What a wonderful, straight forward and timely post. We need need fact-based discussions if we're going to save our democracy from the rancor that is tearing us apart. Good job Dr. Hicks.