


Quality of Life and Economic Growth
Quality of life drives population and employment growth, not low taxes or a business friendly environment

Note: This is an occasional extract from a recent study on Indiana’s Rural economy published by Ball State University’s Center for Business and Economic Research, the Indiana Communities Institute and the Center for Local and State Policy. Much of this analysis is germane to any rural area in the Midwest.
Quality of life is a much discussed, but too little defined component of regional prosperity. Here we attempt to explain how it is measured, what factors contribute most to quality of life, and what impact quality of life can have on employment and population growth. We also explain how a related concept, quality of business environment, does and does not influence population and employment growth.
The most common approach to measuring quality of life (QoL) is the Rosen-Roback model. This approach is based on the understanding that households make trade-offs between the local cost of living and how much money they are likely to make when deciding where to live. But the local cost of living and salary are not the only considerations, and these other considerations are what are termed “amenities.” In general, people are willing to pay a higher cost of living and/or take a lower wage to be close to these amenities. While “amenity preference” will be different for every individual and household, the beauty of the Rosen-Roback model is that it relies on observed behavior rather than reported behavior. For example, surveys routinely report that workers dislike long commutes and would like to live by a beach, yet we observe hundreds of millions of Americans living far away from beaches and/or commuting great distances to work. Measuring quality of life depends on the actual trade-offs people make, so it is more useful to deploy observed behavior rather than stated preferences.
So, how do we observe this behavior? To be clear, we aren’t talking about raw home prices or wages, but on prices and wages conditioned on the characteristics of the home and worker. Simply examining wages, home prices, or amenities can tell us nothing important about the QoL trade-off. We need to control for differences in homes and workers that are independent of local quality of life. Over the past couple of decades, economists have relied on anonymous Census data of individuals and families to measure quality of life. This data tells us the level of education, occupation, and wages of an individual worker, along with demographic data such as age, race and ethnicity. However, due to confidentiality restrictions placed on the important data sources used in this research, researchers have been unable to extend these QoL measurements to geographies smaller than the metropolitan level. That means micropolitan and rural places have yet to enjoy a single market-based measurement of quality of life to inform their local policy choices. This is a serious omission from the places that 1 in 5 Americans live and work. Our research circumvents these data restrictions by using aggregate wage and housing prices prior to the estimation of quality of life.
In a recent study (Weinstein, Wornell and Hicks, 2022) we extended this analysis to the county level across the U.S. This permitted us to measure quality of life in American metropolitan, micropolitan, and rural places. See Figure 1. So, what does that mean for residents of micropolitan and rural places?
Figure 1, Quality of Life Across US Counties (Weinstein, Hicks, and Wornell, 2022)

Source: Bureau of Economic Analysis, Weinstein, Wornell and Hicks, 2022
How can we use our QoL measures?
The study of quality of life has provided urban communities with clear guidance on the development of policy and infrastructure spending for decades. Not so for non-metropolitan places; much of the recent literature on quality of place simply documented the importance of natural amenities for growth in rural areas.[1] While interesting, it is hardly an agenda for local policy or infrastructure spending. From studies like these we know that there are correlations between natural amenities and population growth, however, the theory and empirical work required to infer causation between quality of life and economic outcomes has been missing for non-metropolitan counties. This omission has significantly limited how we understand amenities in non-metro places. In effect, quality of life researchers have simply assumed that micropolitan and rural residents share amenity preferences with urban dwellers.
There are many reasons to believe that this assumption may be incorrect, and our modeling approach allows us to evaluate the role quality of life plays in population and employment growth, while measuring which amenities matter most to micropolitan and rural residents.
In measuring the relationship between QoL and both population and employment growth, we see a strong relationship in both cases. Figure 2 compares our 2010 Quality of Life measure against population growth in Indiana’s 48 rural counties from 2009-2019. This time period is the duration of the recovery from the Great Recession.
Figure 2, Population Growth and Quality of Life in Indiana’s Rural Counties

Source: Bureau of Economic Analysis, Weinstein, Wornell and Hicks, 2022
This figure illustrates a relative measure of quality of life against actual population growth. The effects are remarkable. Moving from the lowest quality of life measure to the average would result in a 3.2 percent increase in population. But, the effect of QoL on employment should be equally interesting.
Figure 3, Employment Growth and Quality of Life, Indiana’s Rural Counties, 2009-19

Source: Bureau of Economic Analysis, Weinstein, Wornell and Hicks, 2022
Figure 3 illustrates the link between QoL and employment growth in Indiana’s rural counties in the wake of the Great Recession. The link is strong, and causal. The Rosen-Roback theories make clear that quality of place influences economic activity (population growth and employment). What is most startling about these two graphics, is not merely the connection between QoL and population and employment growth, but rather the strength of the connection. Note that the scales differ on both graphs (to make them more readable). The actual effect of QoL on employment growth is more than three times stronger than that on population growth over the same period. These findings confirm that improvements in quality of life attract people and jobs, and that the effects matter in rural counties, not just in large urban centers.
Weinstein, Wornell and Hicks (2020) also explained a related concept, Quality of Business Environment (QoBE). This comes to us from Beeson and Eberts (1989) and Gabriel and Rosenthal (2004) who demonstrates that businesses weigh wages and cost of living considerations differently than do households. In general, businesses are willing to pay both higher wages and higher cost of living because both indicate more productive locations. The QoBE measure is important because traditional economic development policies focus on being “business friendly” (i.e., having a higher QoBE) as a primary goal for attracting jobs and people. Figure 14.5 depicts the QoBE for every county in the country.
Figure 4, Quality of the Business Environment across Counties in the USA (2010)

Source: Bureau of Economic Analysis, Weinstein, Wornell and Hicks, 2022
Figures 5 and 6 below show the QoBE measures with population and employment growth in Indiana’s rural counties.
Figure 5, Quality of Business Environment and Population growth in Indiana's Rural Counties, 2009-2019

Source: Bureau of Economic Analysis, Weinstein, Wornell and Hicks, 2022
Figure 6, Quality of Business Environment and Employment growth in Indiana's Rural Counties, 2009-2019

Source: Bureau of Economic Analysis, Weinstein, Wornell and Hicks, 2022
Despite the expectation of many traditional economic development proponents, QoL, not QoBE, drives both population and job growth (again, shown in figures 14.3 and 14.4). Moreover, QoBE, tends to depress population growth, while boosting job growth. These findings strongly suggest that economic development in rural Indiana is likely to be more successful if and when investments are made in quality of life rather than in traditional economic development strategies. This is particularly true if resources, particularly tax dollars, are diverted from quality of life, to traditional economic development policies. In fact, this factor is so robust it warrants additional analysis. Here we illustrate employment growth and the combined state and local tax rates (from IRS files) from 2009-2019 in rural Indiana counties. There appears to be no negative consequences of higher tax rates on employment growth. On the contrary, higher tax rates are strongly correlated with job growth (as well as population growth, which we do not report here).
Figure 7, Employment growth and combined State and Local Tax Rates, 2009-2019
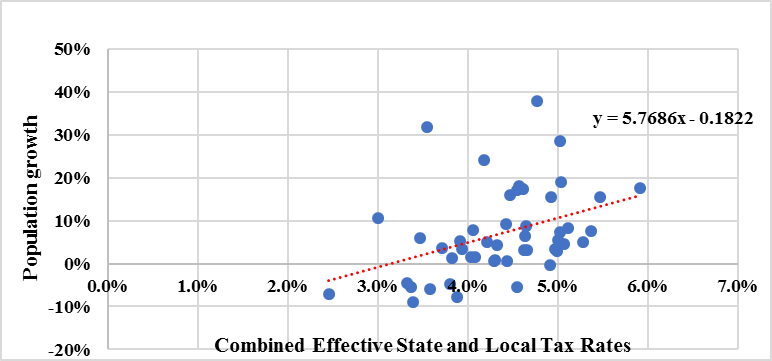
Source: Bureau of Economic Analysis, Internal Revenue Service and author’s calculations
Our findings remain robust across broad geographic regions, metropolitan, and micropolitan counties. In rural counties, we observe better performance of quality of business environment, though the strength of quality of life on population and employment growth remains much stronger than the effect of quality of business environment. We do not report it here, but we find small business growth is also closely linked to QoL, not QoBE. These are interesting findings that should turn attention away from many policies which focus on business attraction through low tax rates, subsidies, infrastructure, and direct workforce training programs. But the most powerful use of this research is in identifying alternative policies to improve the prosperity and economic vitality of non-metropolitan places.
Finally, we use the QoL measures to tell us what specific amenities matter to residents. This directly informs policy development and infrastructure spending in micropolitan places. Using our measure on national micropolitan regions, we categorize all amenities into one of three categories: natural, public, and private. These are, as they suggest, those aspects of a community that are naturally occurring, such as mountains or miles of coastline; provided by state or local government, such as public safety and school quality; or provided by the private sector, such as recreational facilities or restaurants. We then use an algorithm (least angle reduction - LAR) to identify the most significant amenities in each of these categories. Of all the variables we included for consideration, 15 rose to the level of statistical significance. These included variables across all three categories, as highlighted in table 1.

These three broad amenities areas – natural, public, and private – offer different levels of influence. Because all these measures are in logarithmic form, the size of the effect, or the coefficient, is comparable across characteristics. Natural amenities are statistically significant but play a modest role in market-based measures of amenities, additionally most of these amenities are not susceptible to policy changes.
Public amenities matter but have a more nuanced interpretation. For example, high school spending as a share of county level GDP is the most highly valued amenity, but this is really a rough proxy for school quality. Nearly every study of the issue has identified school quality as playing a dominant role in household relocation decisions. Crime is also a major factor, but we think that this is likely a proxy for other unobservable factors such as urban decay or blight.
On the private amenity side, we interpret these as factors that respond quickly to consumer demand. The sole exception to this is the number of worship places per capita, which is negatively correlated with quality of life. We have two hypotheses for this. The first is that a dense number of places of worship are a proxy for a high degree of religious interest, which may be a disamenity to many mobile households. The second hypothesis is that this is a statistical artifact of population change. Newer houses of worship tend to be larger than older ones and located in growing places. Houses of worship tend to close slowly, only after significant population declines. Since we have only a count variable, this would mean growing places with large churches rank low on this variable, while places with a declining population may rank highly. Thus, this metric is correlated without causal inference, due to weakness in the data.
Our results here, coupled with our results on the relationship between QOL and employment growth, are in line with some previous research. These results provide compelling evidence that policymakers in Indiana’s rural counties are likely to receive more robust returns by focusing on improving the quality of life in their towns rather than narrowly focusing on improving quality of the business environment, which has been the dominant goal of economic development specialists for several decades. Importantly, the quality of life policies recommended here are not focused on talent attraction, rather, the focus is on improving the quality of life of existing residents, making a rural county naturally attractive to those with similar preferences.
[1] See Deller et al., 2001; Nzaku and Bukenya, 2005; McGranahan and Wojan, 2007; McGranahan, 2008; Davidsson and Rickman, 2011; Rickman and Rickman, 2011).
Now I more fully understand/appreciate the QoL messaging I've seen on social media this past year. Quite interesting.
How will I break the big negative coefficient for Forest Coverage to my "tree-hugger" friends?
But I do have a straight forward question: might Arts/Culture face similar measurement & correlation challenge to those you mention/hypothesize -and afflict- Worship Places? That is, their scale/count is not 'standardized', so to speak.