
How can we better understand what makes our local economy grow?
or, the use of GDP data to analyze economic development priorities

In 2019 I published this policy brief on the newly released county GDP data. My goal was to illustrate what economists have long known about growth from just a few data points, and then compare that to state policies. The analysis really focused on the contribution of GDP growth from labor, capital and human capital — a traditional growth model.
I focused on a single state since I had the capital data from tax assessments, and I wanted to use a single state to isolate all sorts of institutional variation that might confuse the analysis. This sort of more focused analysis doesn’t appear as often as it should in the academic literature, which is a pity.
The model says that GDP = f(technology, labor, capital and human capital). This has proven to be a very durable model since it was first offered in the 1920’s. The human capital component was added in the 1980’s and it has lots of variations and applications.
It is not a good model for some applications, but in providing a general sense of what policies a state or local government might consider with regard to capital, labor and education it remains surprisingly robust, as I will show.
The study itself offers the technical estimate of the relative contributions of capital (K - in honor of Marx’s useful description of capital flows), labor (N - in honor of Keynes’s use of that notation in his General Theory), A, for technology, and HC for human capital. Modern economists are a bit less into naming things.
This is an area of policy interest since it permits us to calculate the growth in GDP from increasing these inputs. This first figure illustrates by how much a county’s GDP will rise as we add a percent increase in each of these inputs.
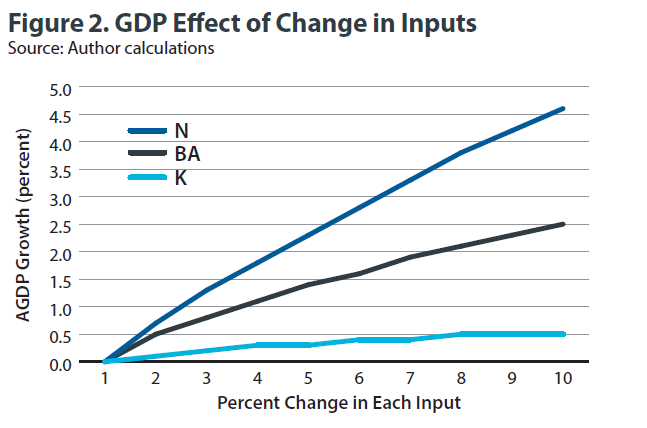
Here, we have N for workers, K for capital (gross assessed value) and BA share of adults as a proxy for human capital. As this figure makes clear, growing the capital stock has little impact on GDP relative to people and education. Of course, the economic development policy focus is primarily on capital attraction, and that is where resources (tax dollars) are being thrown.
Using assumptions that favor (reduce) the cost of capital and increase the cost of education, we can then simulate how growing the capital stock affects GDP relative to educating the workforce. Bottom line, education has much higher returns than capital accumulation in Indiana.

For what it is worth, not a single economist would find this surprising. It is a textbook result in a developed economy, that might appear in an undergraduate Macroeconomics exam.
My only caveat is that decomposing the effect of education (human capital) on all these is difficult. Low human capital places attract capital that substitutes for labor, while high human capital attracts capital that complements labor. Bloom, et. al. (2019) do a good job of showing this in their China Shock paper.
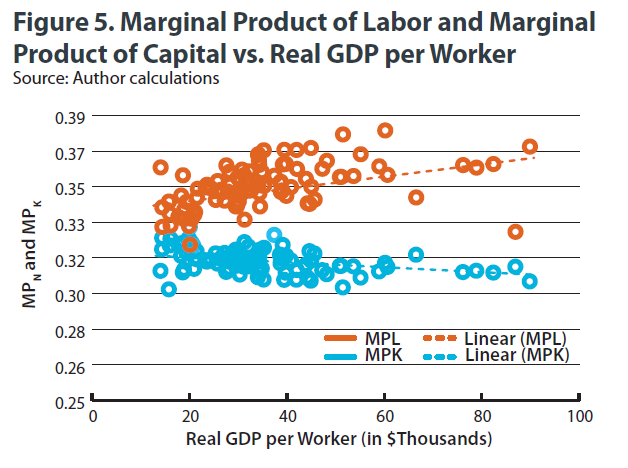
The next step is to use the marginal product of capital and labor to tease out some more interesting snippets. The first is that places with higher marginal product of labor tend to have more productive workers than places with higher marginal product of capital. This is not a tautology. In some places with well educated workers, capital would be matched with highly productive workers, making it very valuable. That is not the case in Indiana.
Importantly, we think population change is partially explained by productivity differences in labor. The causation goes both ways here, as highly productive people move to more productive places, which in turn become more productive and attract more productive (better educated) workers.
This works in reverse as well, as anyone who travels to rustbelt cities and rural places can plainly observe.

Of course, owners of capital aren’t stupid, they wish to move their capital to places where it is more productive.

But, policymakers thirst for this capital investment. I don’t think there’s a good economic explanation for this, but there’s a good political economy explanation for it. It makes nice news releases. . .
But, it turns out that places with less productive capital offer much higher tax abatements. This suggests that the abatements are made primarily to less productive firms. This is an ugly fact, that should surprise few economists. Chris Coyne and Lotta Moburg wrote about this in 2015. So too did Byrnes, et al in 1999. Subsidies that bring in less productive capital, will result in slower GDP growth.

This study also moved into a discussion of automation. The equation above also allows us to estimate the marginal rate of technical substitution between capital and labor. In jargon free terms, that is the ability to substitute people for machines. We match those county level estimates against our county level automation risk data from our 2017 study on vulnerable communities. In that study, we used the Frey and Osborne data to construct county level indices of automation risk.
We then compared the substitutability of labor and capital with automation risk at the county level. I think this is a surprisingly strong relationship that uses two very different data sets and modeling approaches to answer some part of the same problem, which is “where are places more susceptible to automation.”

There’s a lot more to this study, but I did also want to show one more graph, which is the marginal rate of technical substitution and share of adults with a bachelor’s degree. The lower the share with a degree, the higher the substitutability between capital and labor (machines and workers).

Just as a final aside, see how this compares to our 2017 study noted above, where we compare the share of a county’s adults with a BA degree or higher, and automation risk. Again, two different data sources and approaches that yield very similar results.

The conclusion to all this is fairly straightforward. If you think of economic development in broad terms (as it should be), then spending resources on people rather than things will likely improve outcomes with less expense.
Also, if you are subsidizing capital, you may be accelerating automation of jobs (no kidding, if you make something cheaper, folks buy more of it).
This is not an argument against capital, nor is it an argument against automation. It is an argument against dabbling in free markets that you don’t understand and expecting good outcomes.