
Data Centers and Local Job Creation
Some Preliminary Causal Estimates from Texas

Introduction
Data centers supply the storage and processing capacity for data that fuels the rapid growth for such products as digital health records, human resources, and research activities of all types. Data centers also provide the processing capacity for widely adopted artificial intelligence applications.
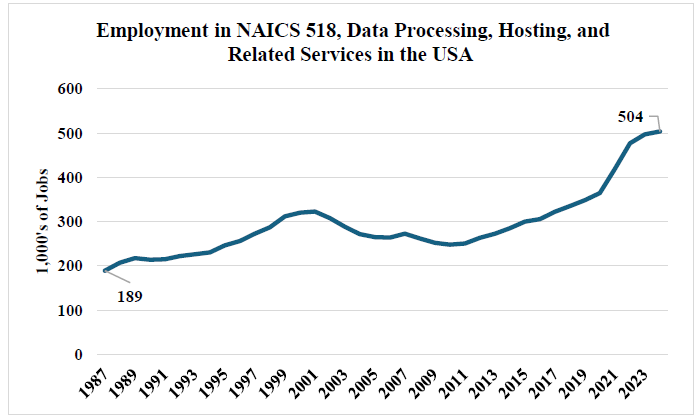
They are not new structures in the United States, but recent years have seen an explosion of new investment, as well as employment. There are today almost 4,200 data centers or as many as 5,400 data centers and over 500,000 workers in the Data Processing, Hosting and Related Services industry (NAICS 518).[1]
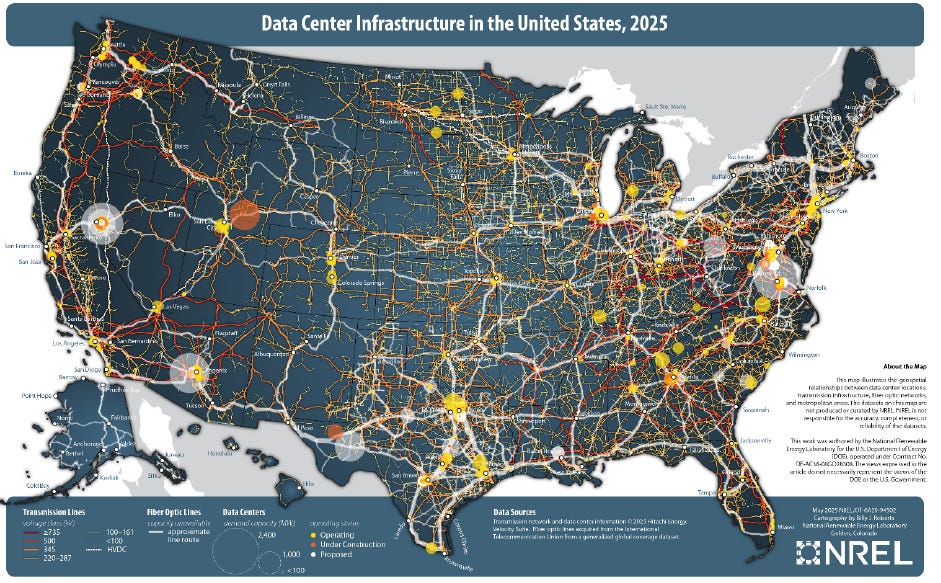
Data centers require considerable infrastructure in the form of electrical grid access (or microgrid connectivity[2]) as well as access to the internet. If they access a microgrid electric power generator, they will typically also be close to a fuel source, typically natural gas. Most require access to water as well, primarily as a coolant. And, like other types of commerce, they require road access. Most do not rely on microgrid power production, rather relying upon commercial power sources. In this way they are much like other businesses that require significant electric power such as manufacturing and logistics firms.
This map, produced by the National Renewable Energy Laboratory is the best graphical depiction of the broad interconnectedness of data centers across the country (and among the coolest maps I’ve ever seen, thanks Billy Roberts).
The rapid growth of this industry and the infrastructure to enable both cloud computing and storage as well as artificial intelligence raises a number of important and interesting economic and public policy questions. What type and how much energy will AI and cloud computing require?[3] How will this affect pricing and reliability of electricity in the USA? What type of infrastructure will it require, and how will the public infrastructure be financed? Are there broader effects on the environment from data centers, including disposal of obsolete equipment?[4] How important are these industries to national defense and could more rapid deployment of AI cut costs for healthcare, manufacturing, education or other sectors of our economy?
This post could be filled with research questions, but among the most urgent is simply the effect on local labor markets of a new data center. It is that question this post addresses. We do so by focusing on a single state – Texas – which has seen considerable deployment of data centers, and has very robust publicly available data on the timing and location of these centers. In order to assess the effect of data centers on labor markets, we use two different causal models of data center entrance to test the effects on labor markets in Information and Construction sectors and subsectors, quarterly.
This work details those effects and outlines the ability of the causal models to inform us about effects and the differences between observed ‘gross’ job flows and ‘net’ job flows surrounding data centers.
This post contains more technical description than most of my posts on this site. I apologize to readers for that, but feel that I have offered enough explanation to make this work clear to an educated layperson (as well as satisfying readers concerned about the value of these estimates in concluding causal effects).
At the end of this analysis, I lay out what it means, what we don’t yet know about the local effects of data centers and how research might be applied to those questions. But, to begin this analysis, I review some of the very limited work that has been done on data centers to date.
Previous Research on Data Center Impacts
The pace of investment in data centers suggests broad expectations about future demand for AI and cloud-based services. There is growing literature on the environmental effects of data centers locally (Lifsat, et al, 2025; Marwah, et al, 2010; and Ewim, Ninduwezuor-Ehiobu, 2023). Ngata, et al. (2025) review the issues surrounding data centers in Northern Virginia, including economic and fiscal effects, and energy costs. They report higher noise levels, higher expected energy prices and mixed fiscal effects in this preliminary work.
What is conspicuously absent are published efforts to model the casual effects of data centers on local labor markets or fiscal conditions. Instead, analysis has mostly been limited to either descriptive analysis (Census, 2025; Nguyen and Green, 2025) or a series of input-output analyses (Morrow County, 2024; Sage Policy Group, 2024; PWC, 2023).
These studies offer some important insights. The Census (2025) study provides the scale of data center growth in recent years. Concerns about limited employment effects and large-scale incentives are offered by Nguyen and Greene (2025) and LeRoy and Tarczynska (2025). LeRoy and Tarczynska offer a particularly well investigated analysis of the fiscal incentives offered to data centers, which I will discuss more later.
These are good examples of case study type analysis of the impacts of data centers on local labor markets. The remaining studies made estimates based upon multiplier effect of employment within the data center.
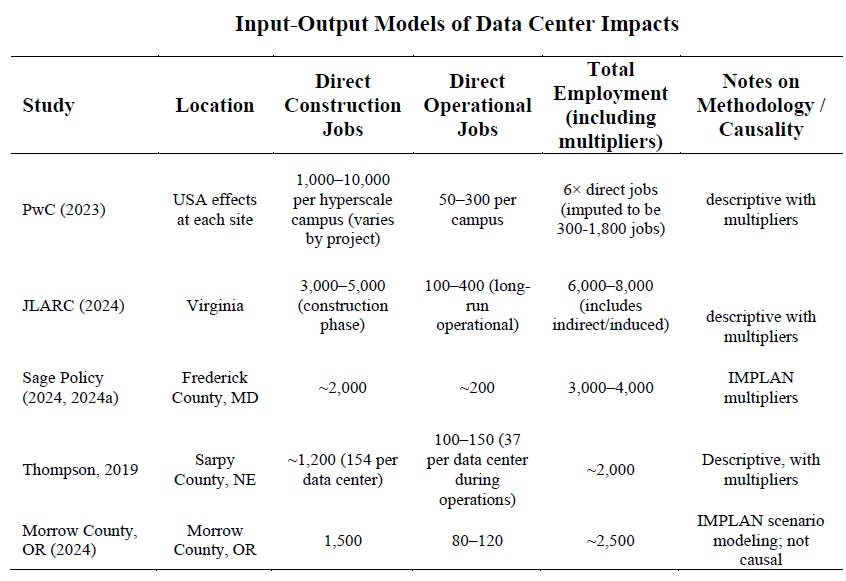
Input-Output modeling of economic impacts has a long history, and several well-known limitations. The key challenges to this methodology are that they do not estimate net, but gross effects of new investment. That is equivalent to assuming labor markets are perfectly elastic, and so every new job opening at a data center results in a new job for the region. This is a very restrictive assumption that should have a limited role in considering policies to affect the location of new business establishments.
An example of a well performed input-output estimates is Thompson (2019) estimate of effects of Sarpy County data centers. We will compare these findings below, since they offer some good insights. Still, better methods exist to more fully explore the causal effect of data centers on local employment growth. The following outlines those initial findings.
Data and Analysis
In the remainder of this study, we offer the first casual estimate of labor market effects of data centers in the USA. We study Texas, since it has seen considerable growth in data centers, with very clear publicly available data from the Texas Comptroller. The public availability of the data is due to very generous tax incentives (as reported in LeRoy and Tarczynska (2025), which is reported along with application dates – a good proxy for initial construction and deployment. There is disagreement regarding the number of data centers between the comptroller and the commercial site Datacentermaps.com. However, we believe this is largely a matter of aggregating facilities from the same operator in two large urban areas. We discuss a remedy for this later.
Texas data centers have also grown substantially, mirroring much of the national growth depicted earlier. Data centers in Texas are eligible for differing incentives based on size, so the centers are listed as registered data centers and large data centers (over 100,000 square feet). This terminology used in the Texas statute.
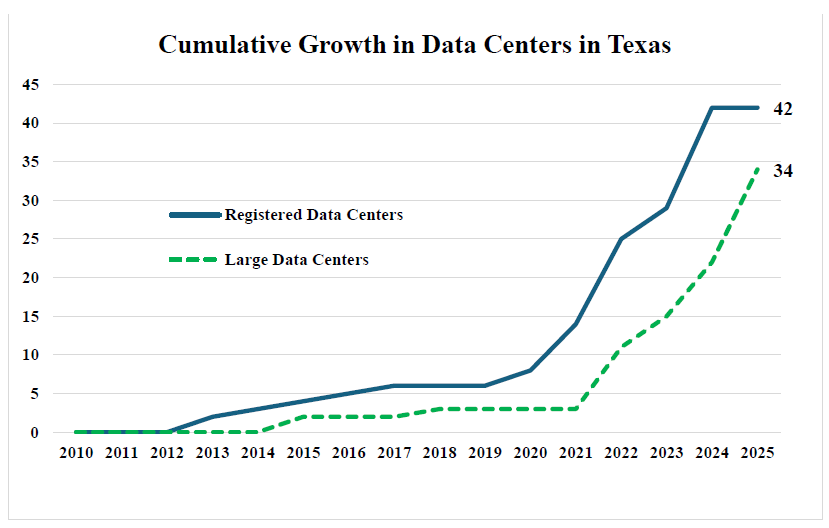
These data give us reliable and accurate information on the opening of data centers in Texas. The precise timing of data center openings matches well with Quarterly Workforce Indicators data on employment for 254 Texas counties.
These data elements set the stage for casual estimate of labor market effects, using a staggered difference-in-difference model (Goodman-Bacon, 2021). Because this is the first of these types of studies on data centers, indulge me with a bit of technical explanation in what is otherwise a more plainspoken blog. This model takes the specification:
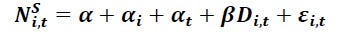
Where employment (N) in sector s, in county i, in quarter t, is a function of a common intercept , and a common time and cross-sectional fixed effect ( a count of opened data centers, D, in county i, in quarter t. The value is the estimated difference in difference coefficient, which is interpreted as the effect of opening a new data center on employment in the host county. The white noise error term is the unexplained variation in employment in sector s, in county i and date t.
A clearer way to think about this for people not heavily invested in more recent econometric techniques is simple. The difference in difference estimate attempts to mimic a randomized control trial. To do so, we assume that the counties who see a data center located within their borders are growing at the same rate as those without a data center. So, in the first question, we examine the difference between those with and without data centers (that is the first difference). The second difference is the change within a county after it gets a new data center. That is the second difference, which together give us the difference-in-difference terminology.[5]
Again, we assume that the counties with and without datacenters are growing at the same rate before getting a data center, and rely upon statistical tests to ensure that is the case (I will discuss them briefly for each test). This is the “parallel trends assumption”. We also use a count treatment variable, to account for each new data center. Using a simple 0, 1 measure of the presence of a data center gives similar results, but misses the incremental effect of each new center. We used this as a robustness test to account for possible data errors associated with aggregating data centers under the same tax incentive registration in the Texas Comptroller data.
The time and cross-sectional fixed effect ( are assigned to each year and each county. Those variables control for any omitted or unobserved variations in employment that would be either common to all counties in a specific period (like a recession or pandemic), or specific to each county across its entire period of this sample (such as being part of a metropolitan area).
If the key assumptions hold (a common pre-treatment trend is most important here), difference in difference estimate is a gold standard for casual estimates outside of a randomized control trial, which is vanishingly rare in economics. However, it is also useful to use an event study, which is a somewhat older form of causal analysis. This provides additional confirmation of the parallel trends assumption, and offers some insight into the dynamics of job creation surrounding something like the construction and opening of a data center. The equation for an event study appears as follows:
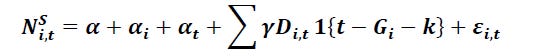
Where employment (N) in sector s, in county i, in quarter t, is a function of a common intercept , and a common time and cross-sectional fixed effect ( a count of opened data centers, D, in county i, in quarter t. The value is the estimated coefficient in t-k and t+k (lags and leads) to the opening of a data center D. This is interpreted as the dynamic effect of opening a new data center on employment in the host county. The white noise error term is the unexplained variation in employment in sector s, in county i and date t.
More plainly, this shows how employment changed in the selected quarters before and after the opening of a data center, by estimating employment impacts in several quarters before and after the opening of a data center.
To model these impacts, I used data from Quarterly Workforce Indicators by county from 2000Q1 to 2024Q4 for 2- and 3-digit NAICS codes in selected sectors. We use data starting in 2001Q1 for the 4-digit NAICS codes, as early data was not reported. To test if this might have an effect on results, we altered the start dates for the 2- and 3- digit estimates, and found no variation in estimated effects. This is unsurprising given that the start date of these series is a decade prior to the first data center opening in Texas.
Throughout this work, we focus on job changes in the Information (NAICS 521) and Construction (NAICS 23) sectors. NAICS is the standard acronym for the North American Industry Classification System, which links businesses into similar, or related activities.
Information (NAICS 51) is the broadest related sector, that includes producing and distributing information. This is a broad sector covering data centers, and also movies and record recording, publishing, broadcasting and the deployment of physical infrastructure related to any of these activities. We also estimate the effect of data centers on the more restrictive 3-digit NAICS 518, which is Data Processing, Hosting and Related Services. This is mostly data center type employment.
At the 4-digit NAICS code, we have the 5182 subsector, or Computing Infrastructure Providers, Data Processing, Web Hosting, and Related Services and 5415, or Computer Systems Design and Related Services. These are more disaggregated sectors related to data centers. Importantly as we move down to the county level, the more detailed industry categories are often suppressed to preserve firm anonymity.
We are also interested on the effect of data center deployment on construction employment. So, we estimate the Construction (NAICS 23) sector as well as subsectors Commercial and Institutional Building (NAICS 2362), which is the most likely sector engaged in data center construction. We also examine NAICS 2361, Residential Building Construction, and NAICS 2371, Utility Systems Construction, to examine potential net effects on construction employment during and after the construction of a data center.
The analysis here begins with the effect of a difference-in-difference estimate of data center openings at the county level in Texas from 2000/2001 to 2024:Q4, on four different definitions of the data center industry (from the broadest, to the narrowest available). For brevity, I report two elements of these estimates, the effect and the test of parallel trends. The effect estimate is the average treatment effect or net number of jobs in that sector that are attributable to the opening of a data center. Underneath the reported effect is the t-statistic which provides a level of statistical certainty for the effect estimate. The parallel trends statistic offers a measure of certainty regarding the comparable employment trends in that sector in counties that eventually host a data center compared to those which do not. The null hypothesis is of parallel trends, so statistical significance here reflects a rejection of parallel trends. In other words, if this value is statistically significant we should have little trust that our model tells us anything about the effect of data centers because the places in which they were located were already differing in job growth from those that never received a data center.
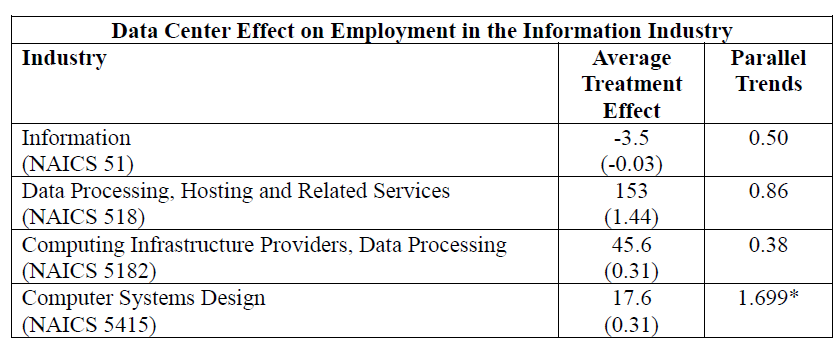
This table tells a clear story about the net effect of data centers on employment. In no case was the effect statistically significant to traditionally acceptable levels (P=0.10 or better). Across NAICS 51 (all Information services and infrastructure) we actually observe a very, very small negative effect, which is rightly interpreted as a ‘no net effect’ outcome. Across the less aggregated data processing sector (NAICS 518) we estimate 153 net jobs created, but this estimate has very low statistical certainty.
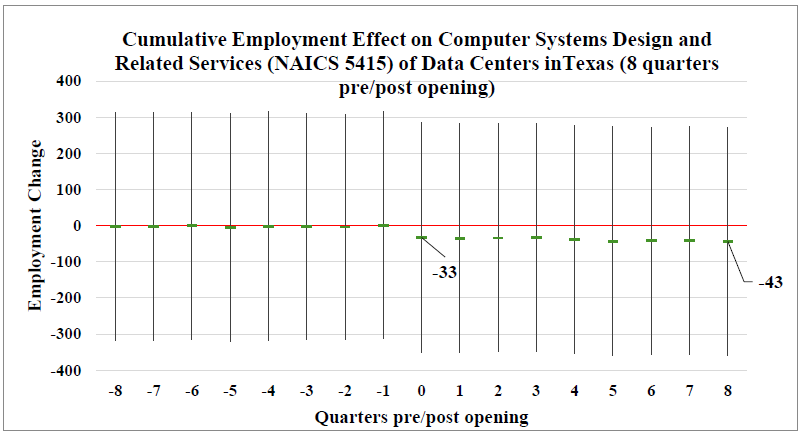
In the two most disaggregated sectors of NAICS 5182 and 5415, the net effects were roughly 46 and 18 jobs. However, in both of these estimates the statistical certainty is effectively zero. And, for the Computer Systems Design sector (NAICS 5145), we can reject the presence of parallel trends, which means the difference in difference framework does not offer a suitable causal interpretation.
It is interesting to compare these estimates with those from the best of the input-output modeling approaches (Thompson, 2019). In their estimate of a single data center (assuming construction duration similar to a wind facility), they report annual construction impacts of 154 persons and operations of 37 persons.
Table reported from Thompson (2019) input-output modeling of data centers in Nebraska
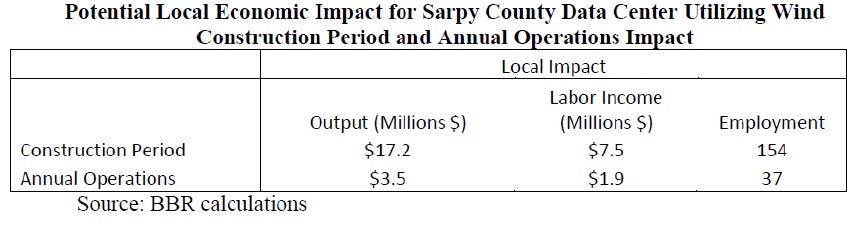
This estimate based on gross job flows looks very similar to the point estimates I provide for the less aggregated sector. The salience of these findings is that the causal estimate of net job flows attributable to data centers is zero, while even the gross job flow estimates are very modest – less than 10% of the gross employment effect of a WalMart Supercenter.
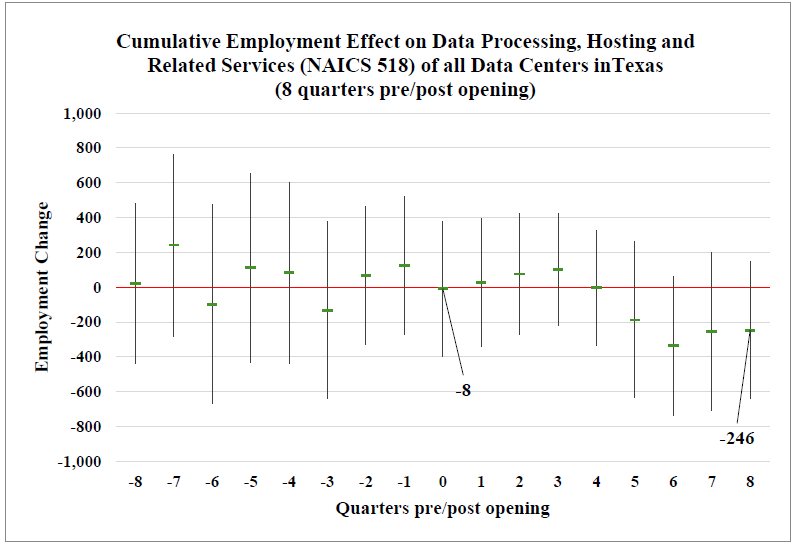
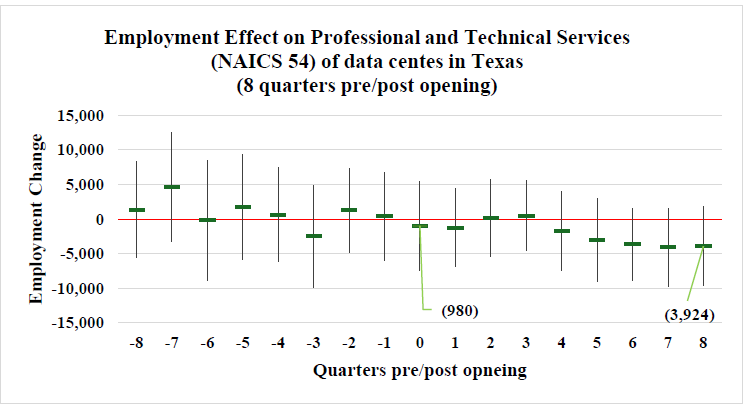
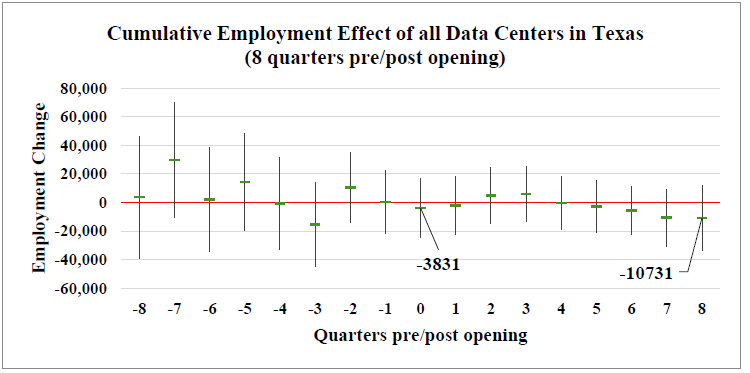
An alternative approach to estimating the impacts of data centers is the event study I described above (see Roth, 2022). The following graphs depict the estimation results of the event study on employment. The graphs illustrate effects 8 quarters before and 8 quarters after the reported opening quarter of the data center. The graphic depicts he point estimates (thick horizontal bars, and the 95% confidence interval (thin vertical bars).
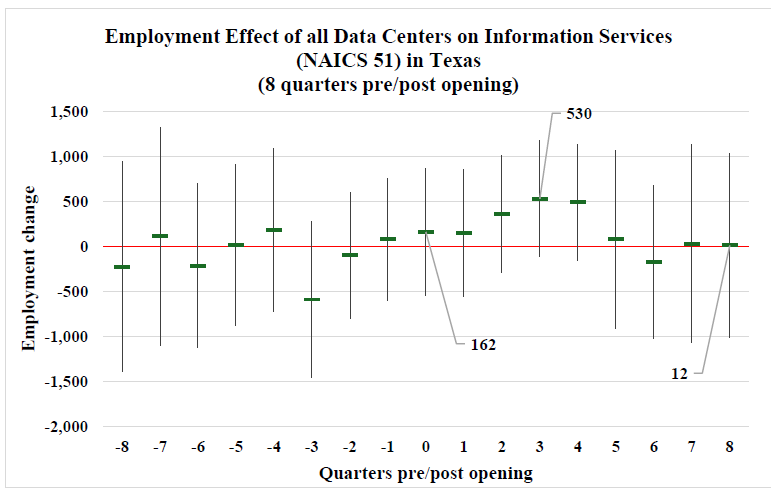
Here, we observe no statistically significant results for three of the four estimates. These correspond to the difference in difference results discussed above. Thus, there is no discernable industrywide effect of data centers on Information, though the point estimate is large in the early quarters, which may reflect a surge of Information (NAICS 51) employees during the construction and early operations phase of the data center.
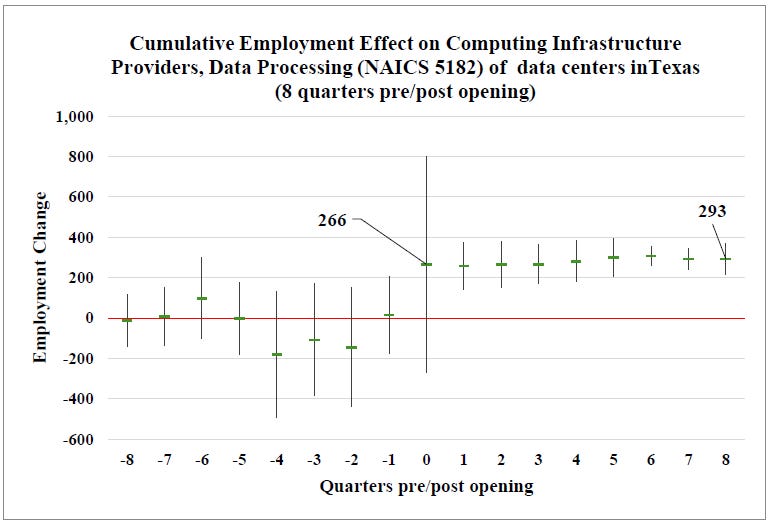
Within the Computing Infrastructure Providers, Data Processing (NAICS 5182), there is a large point estimate. This is much is larger than those depicted in the difference and difference table above. It is not statistically significant in the initial treatment period; however, the cumulative effect is well above the 95% confidence interval for this series. The very high variance (large confidence interval in the quarter of the data center opening) suggests either some error in the data on the timing of opening, or variance in the actual hiring of workers in the 5182 NAICS. This simply means the new jobs for the data center are less statistically certain in the initial periods, a very plausible outcome that should be of no concern.[6]
This surge of employment within the NAICS 5182 sector is permanent, but the net effect within the broader sectors (Information, NAICS 51) strongly suggests that this growth is offset by declines in other parts of this industry. This makes sense – we can obviously see new jobs with a data center – but these are gross, not net new jobs.
Interpreting these results as net versus gross effects is fairly straightforward. All data center activities (except for some construction employment I discuss below) falls under the Information (NAICS 51) and Data Processing, Hosting and Related Services (NAICS 518). Within those sectors there are no related job growth associated with data centers. Indeed, the point estimates suggest net job losses at a very low level of statistical certainty.
Within Computing Infrastructure Providers, Data Processing (NAICS 5182) there is a gross increase in jobs associated with data centers. But, NAICS codes are hierarchical, so that any growth in NAICS 5182 is being offset by job losses among the other family of NAICS 51 in that county. Thus, these estimates all conclude that the net effect of data center employment within a county is effectively zero across thes industries
One way to make that clear is that since 2010, when the first data centers started opening nationwide, the Information sector (NAICS 51) has grown by 237,000 jobs. But, within that broad sector, NAICS 517, Wired Telecommunications Carriers have lost 294,000 jobs, while NAICS 518, Data Processing, Hosting, and Related Services has gained 256,000 jobs. The other sub sectors of Information are seeing similar adjustment. What is likely occurring is simply that technological change is resulting in a change in the NAICS code under which many of these people are working.
Indeed, the shift in net jobs from NAICS 517 to 518 could well have involved many of the same men and women, and the same companies, but they are merely doing work under a different NAICS code. This is akin to the roughly 1/3rd of manufacturing job losses during the China Shock period that were attributable to a change in NAICS codes for existing firms (see Bloom, Handley, Kumar and Luck, 2018).
This finding suggests that, as the Input-Output studies also conclude, there is a gross increase in data center jobs in a county, when the data center opens. But these results conclude that these job cuts are offset by job losses in other sectors. In other words, though there are gross job flow changes, there is no discernable net change in jobs associated with the data centers in Texas.
Notably, the more robust of the two methods finds no statistically discernable effect of data centers even in the Computing Infrastructure Providers, Data Processing sector (NAICS 5182). The average treatment effect, or the average annual additional jobs created from each new data center is low (~ 46 workers) and of such low statistical certainty that it is correctly interpreted as zero.
This still leaves open the possibility that there are effects outside of the Information sector. Here we focus on construction. The purpose is to understand the effect of data center employment on construction both on the data center, on other infrastructure and on residential housing units. The results of the difference in difference estimate appears in the table below.
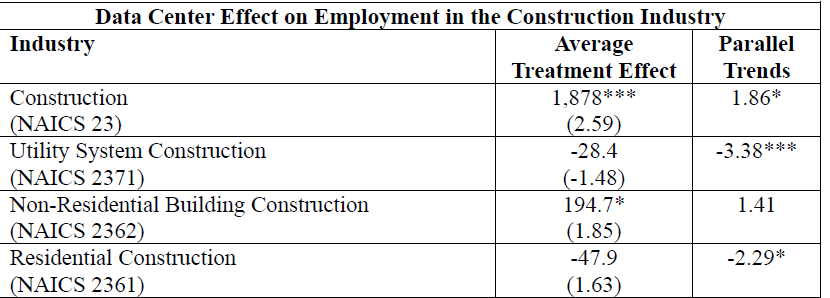
As with the Information (NAICS 51), the Construction (NAICS 23) is hierarchical. Thus, these data represent the effects industry-wide as well as movement of jobs within the industry. So, the effects are mixed here between net jobs in Construction (at the highest level of aggregation) and gross job flows between sub-sectors.
Across the Construction sector (NAICS 23), our model reveals that counties which eventually host a data center experience a statistically different trend in growth prior to the opening of the data center than other counties. This violation of the pre-trends assumption biases the estimate of the average treatment effect. The same problem holds for both employment in Utility System Construction (NAICS 2371) and Residential Construction (NAICS 2361). So, there’s no need to further discuss the effects from this difference in difference estimate on employment for NAICS 23, 2371 or 2361. We’ll turn to alternative methods shortly.
In contrast, the effect on non-Residential Building Construction (NAICS 2362) was statistically significant and relatively large at roughly 195 jobs created with the opening of each new data center. Unlike the other estimates, both the counties with and without data centers had similar pre-opening employment trends in this sector. This gives us confidence in the usefulness of the difference in difference estimator in this context.
As with the Information sector estimates above, it is useful to examine an event study to compare with the difference-in-difference results. Event studies offer an alternative estimate, which is primarily important when the pre-trend equality assumption is not valid. So, for the purposes of our inquiry here, these event studies will be most useful in evaluating the employment effects of data centers on NAICS 23, 2371 or 2361. For non-Residential Building Construction, the difference-in-difference estimator is the more reliable tool of analysis.
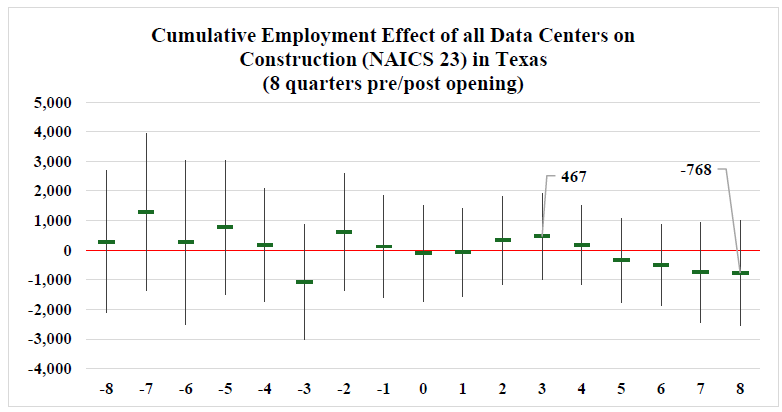
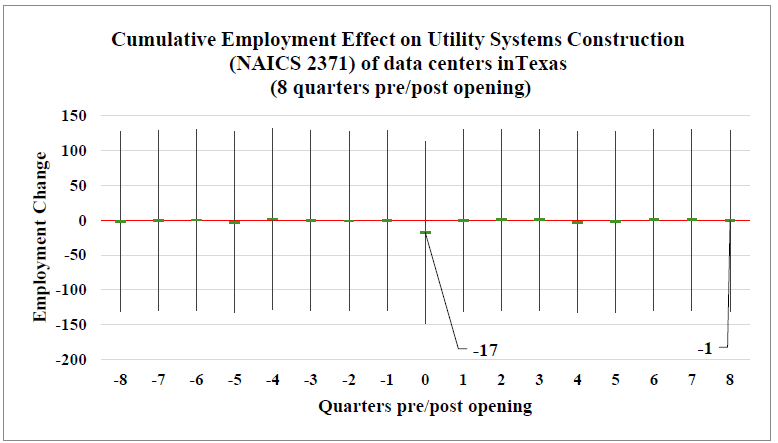
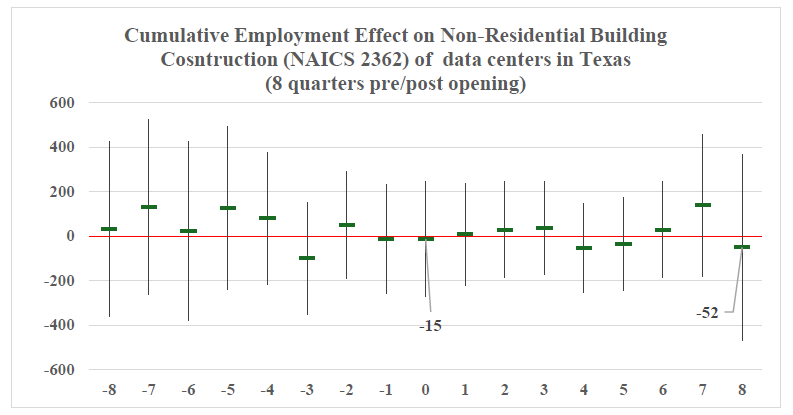
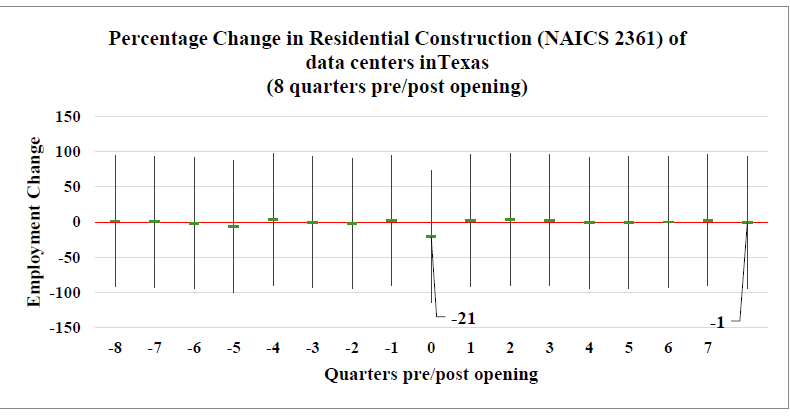
None of these event estimates provide evidence of net employment growth in Construction due to the entrance of a data centers that rises to the level of statistical significance. However, the DiD estimate of non-Residential Building Construction identifies an average treatment effect of 195 jobs. This is the sector most likely associated with new data center construction, so this is a very plausible finding. It is also similar to the gross job flows identified in Thompson (2019) input-output analysis of data centers in Nebraska.
Decomposing the overall effects within the Construction sector (NAICS 23) is useful in understanding local dynamics of employment. Keep in mind construction employment is both highly seasonal and employees tend to be highly mobile between firms. So, there’s a great deal of flexibility in the construction sub-sector workers might be employed in. For example, the same team of workers may work concrete for a Residential Construction (NAICS 2361) for several weeks, then do the same work for a Utility Construction (NAICS 2371) and then in a non-Residential Building Construction (NAICS 2362) all in the same quarter.
Job flows between firm or NAICS sector is heavily studied, and generally a hallmark of a healthy labor market (Haltiwanger and Schuh, 1999). In the context of data centers, it matters only in the context of public policy in permitting or incentivizing their development. I discuss this more in the summary.
There are other methodological issues that would appear in a longer, more technical study, but are worth mentioning in passing. In conducting a staggered difference-in-difference analysis, it is helpful to conduct a Goodman-Bacon (2021) decomposition of the source of effects. This decomposition permits us to identify how much of the employment effects are caused by comparing a county with a new data center against all counties that did not receive a data center during the sample period, as well as those that received one earlier in the sample period. In each of the cases described above, well over 90% of the discernable impact (estimated average treatment effect) came from comparison to counties that never received a data center.
A second tool for making comparisons when the treatment effect (opening of a new data center) varies in different locations is the Callaway and Sant’Anna (2021) method that allows us to compare effects between different periods. Again, in these examples, counties with data center construction earlier (say in 2013-2015) experienced larger employment effects than counties that received them later in the sample. This could be due to shorter post-entrance data (I have only through 2024:Q4 employment data), but it could also be a consequence of more efficient, or less labor intensive installation processes.
There are data considerations worth discussing as well. The first of these is that we have not conducted a thorough test of the Stable Unit Treatment Value Assumption (SUTVA) (Delgado and Florax, 2015). This assumption is important in an economic geography study such as this, which examines contiguous counties. The issue is whether there is some spillover of data center operations onto adjacent counties. In examples where there are spatial spillovers, the SUTVA assumption is likely violated. However, if we cannot detect employment effects within the county in which a data center is built and operated, it seems axiomatic that we would not observe effects in adjacent counties. A full technical study would still perform this test (even though the SUTVA assumption is almost certainly not violated here).
The Quarterly Workforce Indicators suppress data for some counties in some periods due to a small number of observable firms. In one instance above (Residential Construction), we assumed that the suppressed data was actually zero in order to conduct the event study, which otherwise would not have sufficient observations. This did not meaningfully alter our results.
We also tested effects in other potentially related sectors, such as overall employment and professional technical services. In both these estimates, the parallel trends assumptions were violated, so the traditional difference in difference estimates provided no insight. The event studies confirmed no net job growth due to data centers locating within a county.
These are interesting observations about the employment dynamics within information and construction sectors. But, as mentioned earlier, the appropriate interpretation of these empirical tests is that there are zero net employment effects due to data centers.
Next Steps and Policy Considerations
These causal estimates of both net and gross job flows due to the opening of data centers in Texas offer a number of important conclusions. First, input-output modeling, particularly when performed with care (such as Thompson, 2019) accurately estimate the gross job flows associated with data centers. They do not capture net job flows within the broader industrial sector associated with the construction and operation of data centers, nor do they capture economy wide effects. The causal estimates reported above show no net job growth associated with data centers.
There are other issues that pertain to data centers which require more analysis. It would be useful to have more geographic variability, particularly across places with differing incentive structures. It would be useful to tie incentives to employment and wage effects. This would be especially useful in determining whether or not capital incentives are distorting the capital to labor ratio in these sectors.
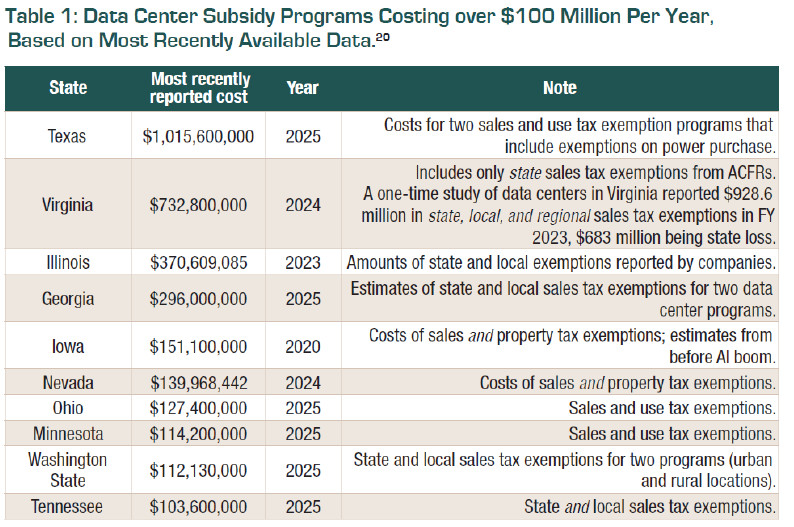
The magnitude of incentives are quite large. Texas alone reports more than a billion dollar subsidies to their data centers (see table reproduced from LeRoy and Tarczynska (2025), at Good Jobs First).
There is ongoing work reviewing environmental externalities of data centers, these should be informed by casual techniques as well. Among the potential tests are hedonic pricing models of individual data center effects on home valuation. Ngata, et al. (2025) noted sound effects, but did not perform non-market valuation of these effects. Effects on energy prices are also an important consideration for policymakers when considering the net effect on their communities.
There are many other issues that extend beyond local effects, such as effect on national energy use, mix of fuels, etc. Those are outside the scope of this work.
Of course, all these estimates should be balanced against potential benefits of data centers. Given their large capital purchases, most state and local governments should experience growth in sales and use as well as property tax revenue from these activities. Those revenues could be deployed to improve local amenities, offset other revenues or compensate households experiencing negative externalities.
What is very clear from the results of these causal estimates of employment effects is that fiscal incentives for data centers cannot be justified on the grounds of job creation. State and local governments should suspend existing tax incentives and defer any future incentive decisions until more analysis has been completed.
References
Goodman-Bacon, Andrew. “Difference-in-differences with variation in treatment timing.” Journal of econometrics 225, no. 2 (2021): 254-277. https://www.sciencedirect.com/science/article/pii/S0304407621001445
Bloom, Nicholas, Kyle Handley, André Kurmann, and Philip Luck. “The impact of Chinese trade on US employment: The good, the bad, and the apocryphal.” In American economic association annual meetings, vol. 2019. 2019.
Beckler, Hannan, Rosemarie Ho, Narimes Parakul, Dakin Campbell and Ellen Thomas. “How Business Insider Investigated the True Cost of Data Centers.” Business Insider, 2025.
Callaway, Brantly, and Pedro HC Sant’Anna. “Difference-in-differences with multiple time periods.” Journal of econometrics 225, no. 2 (2021): 200-230.
Data Center Coalition, and PwC. 2023. Economic, Environmental, and Social Impacts of Data Centers in the United States. Washington, DC: PwC. https://datacentercoalition.org
Delgado, Michael S., and Raymond JGM Florax. “Difference-in-differences techniques for spatial data: Local autocorrelation and spatial interaction.” Economics Letters 137 (2015): 123-
Ewim, Daniel Raphael Ejike, Nwakamma Ninduwezuor-Ehiobu, Ochuko Felix Orikpete, Blessed Afeyokalo Egbokhaebho, Akeeb Adepoju Fawole, and Chiemela Onunka. “Impact of data centers on climate change: a review of energy efficient strategies.” The Journal of Engineering and Exact Sciences 9, no. 6 (2023): 16397-01e.126.
Haltiwanger, John C., and Scott Schuh. “Gross job flows between plants and industries.” New England Economic Review (1999): 41-64.
Hicks, Michael J., and Dagney Faulk. “The Impact of a State-Level, Place-Based Economic Development Program: A Difference-in-Differences Approach.” Economic Development Quarterly 38, no. 3 (2024): 195-208.
Joint Legislative Audit and Review Commission (JLARC), Commonwealth of Virginia. 2024. Data Centers in Virginia. Richmond, VA: JLARC.
LeRoy and Tarczynska (2025). Cloudy with a Loss of Spending Control: How Data Centers Are Endangering State Budgets. Good Jobs First, April 2025. Washington, DC: Good Jobs First.
Lifset, Reid, Pranava Raparla, Amy Stein, Lauren Bridges, Jim McElfish, and Tim Cywinski. “Local Environmental Impacts of Data Center Proliferation.” Env’t L. Rep. 55 (2025): 10131.
Marwah, Manish, Paulo Maciel, Amip Shah, Ratnesh Sharma, Tom Christian, Virgilio Almeida, Carlos Araújo et al. “Quantifying the sustainability impact of data center availability.” ACM SIGMETRICS Performance Evaluation Review 37, no. 4 (2010): 64-68.
Morrow County, Oregon. 2024. Economic Impact Analysis—Data Center Development. Morrow County Planning Department.
Ngata, Wacuka M., Noman Bashir, Michelle Westerlaken, Laurent Liote, Yasra Chandio, and Elsa Olivetti. “The Cloud Next Door: Investigating the Environmental and Socioeconomic Strain of Datacenters on Local Communities.” In Proceedings of the ACM SIGCAS/SIGCHI Conference on Computing and Sustainable Societies, pp. 769-774. 2025.
Nguyen, Terry, Ben Green (2025). What Happens When Data Centers Come to Town? Gerald R. Ford School of Public Policy.
Roth, Jonathan. “Pretest with caution: Event-study estimates after testing for parallel trends.” American Economic Review: Insights 4, no. 3 (2022): 305-322.
Sage Policy Group, for Maryland Tech Council and Frederick County. 2024. The Economic and Fiscal Impact of a Data Center (Quantum Frederick). Frederick County, MD: Sage Policy Group.
Sage Policy Group, and Maryland Tech Council. 2024. The Economic and Fiscal Impact of Three Rowan Digital Centers. December 2024. Baltimore, MD: Maryland Tech Council.
Schulze, Fabian A., Hans-Knud Arndt, and Hannes Feuersenger. “Obsolescence as a future key challenge for data centers.” In Advances and New Trends in Environmental Informatics: Digital Twins for Sustainability, pp. 67-78. Cham: Springer International Publishing, 2020.
Shehabi, Arman, Sarah Smith, Dale Sartor, Richard Brown, Magnus Herrlin, Jonathan Koomey, Eric Masanet, Nathaniel Horner, Inês Azevedo, and William Lintner. “United states data center energy usage report.” (2016).
Thompson, Eric. 2019. Economic and Fiscal Impacts of Sarpy County Data Centers. Omaha, NE: Greater Omaha Chamber.
U.S. Census Bureau. 2025. “Data Centers Growing Fast and Reshaping Local Economies.” U.S. Census Bureau, January 6, 2025.
[1] See Data Center Map and Statista websites for frequently updated estimates.
[2] The Center for Climate And Energy Solutions reports 692 microgrids (all fuel sources) in the USA.
[3] See Shehabi, et al, 2016 for an early review.
[4] See Schulze, Arndt and Feuersenger (2020) for an early assessment of issues in obsolescence.
[5] For a fuller, more technical explanation, see Hicks and Faulk, 2025 analysis of place based economic development programs.
[6] Essentially, if a data center construction takes place early in a quarter and hiring is complete, we would expect larger gross job flows within that quarter. If the construction started at the end of the quarter, we would expect fewer gross job flows. So, the variance observed in the reported opening quarter is most likely simply a consequence of within quarter variation of construction and operations.
I have two policies that can address many of these issues https://www.facebook.com/dawn.barnhart.77/posts/pfbid02BWm65zMZUdsyVF3SbesdywFVtyYrep6qPwnB53GvjkAeBpNYVc5EQ15oktHhSqUnl https://www.facebook.com/dawn.barnhart.77/posts/pfbid02pAs2XXXzyetWdeFexPx1npim59h18DnFuqxQ6hBm6UMvtCJgqHxKV8MYthFgXyEKl
please check them out]
This sentence is not self evident to me: " There are today almost 4,200 data centers or as many as 5,400 data centers" but keep in mind econ is not my home turf.