


Can Multipliers tell us something useful about the usefulness of traditional economic development policy?
A summary of my chapter of the Vulnerable Communities book

This post is a brief summary of my chapter in the excellent edited volume by my colleagues, Jim Connolly, Dagney Faulk and Emily Wornell. My argument is that economic multipliers reveal the ultimately poor performance of traditional business attraction policies in the U.S. I’d encourage readers to buy the book. It is simply a fantastic collection that should help everyone think more effectively about state and local economic development policy.

The idea of the economic multiplier forms the foundation for local economic development efforts in the vast majority of county or municipal governments in the United States. Local government or quasi non-governmental organizations attempt to lure firms to regions in the expectation that their presence will boost overall economic activity. Estimated economic multipliers quantify this hope, and thereby justify tax incentives, discrete infrastructure spending, the deployment of workforce training funds and other support for new businesses. Local economic development officials also use multipliers to justify spending on failing firms to prevent a negative impact on their community.
Multipliers are a real thing in the sense that if new employees move to a region, more people and job opportunities typically follow. But, the notion of an economic base model to explain economic growth has been an intellectual dead end for decades.
Despite well-known problems with economic base theory in general (Krugman, 1991, 2011), the use of employment multipliers derived from economic base theory is a low cost, easily interpreted tool for explaining the potential effects of changes to firm size or location on a local economy. The general approach to interpreting multipliers assumes symmetric effects and nearly perfect labor supply elasticity. Thus, a labor demand shock in tradable sector (footloose) employment will generate an employment multiplier value that is insensitive to the direction of the impact and highly elastic.
But, I don’t buy this. Why would a job coming in cause the same effect as one leaving? That symmetry is a pretty restrictive assumption. So, I adapted a method tax economists use to measure asymmetry in tax rate changes to measure the effects of an increase or decrease in manufacturing jobs on non-manufacturing employment in the USA. I used county level data for three periods from 1970 through 2015.
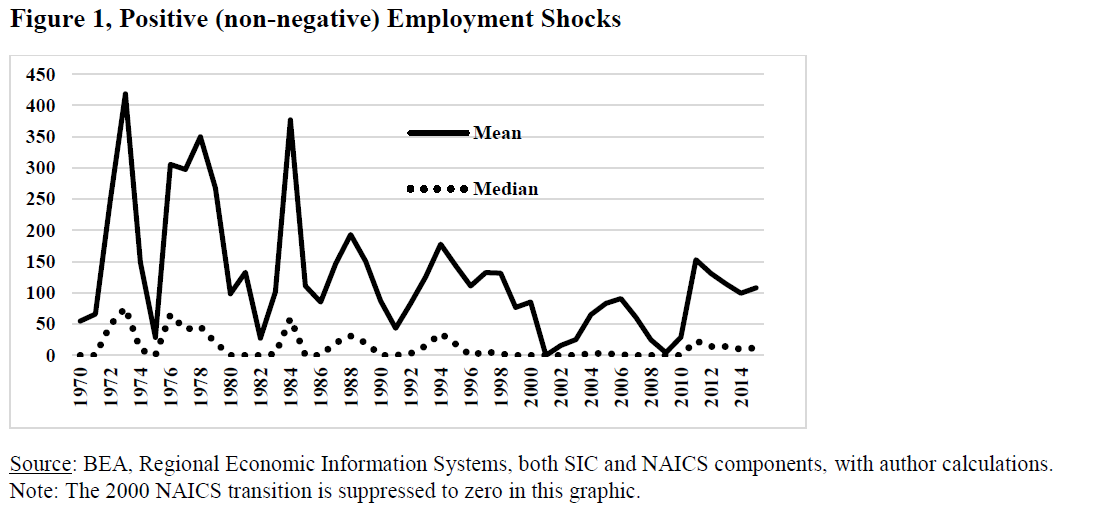
As these graphics show, there has been some pretty big shocks to manufacturing employment. You can see the big employment shocks of the 70’s, followed by a more stable employment, followed by the China Shock and Great Recession.

The estimate of the multiplier is relatively straightforward. The asymmetric approach is novel (or at least I haven’t found anything on it for 40 years). I used the Bartik instrument to identify local shocks. I’ll talk about one set of findings here, though I did a lot more for the technical chapter, the results don’t differ meaningfully.
I separated the U.S. counties into large urban places, small urban places and non-urban places. I then used three different periods of time. I wanted to see if multipliers are symmetric (i.e. the same if positive and negative shocks) and whether they played out across counties differently based upon geography. I also wanted to know if the multipliers were different over time.
I’ve written a lot on changing preferences of workers in their choice of location and how quality of life matters. Does this play out over time with multipliers?
Table 3 in the chapter reports the positive and negative multipliers, by geography nd time period. All of these are strongly statistically significant, and differ from one another (hence the *** to report the Wald test of differences). Note, I’ll use the non-spatially adjusted estimates graphs below. That’ll tease you to buy the book.

So, what’s this mean? Focusing on the time first. In all instances, the big multipliers occurred in the early periods. Until the most recent years (2000 through 2015) the negative shocks were worse than positive shocks. But, how’d this play out by geography and time?

To begin that discussion, you just have to realize how much less important manufacturing has become as a source of jobs. At the start of our sample, factories employed more than one in four workers, while today it is fewer than one in ten. This alone wouldn’t really explain the change in multipliers, except for one feature. In most places where factories are located, there are increasingly more, different employment options. So, fewer people move to factories for employment, instead local workers will fill these jobs. Alternatively, as jobs leave, displaced workers can find another job.

Starting with large urban places (counties in cities of over $1,000,000 people), we see a similar pattern, but with one key difference. Since 2000, the positive shock has outpaced the negative shock. So, acquiring 100 new factory jobs will result in 238 non factory jobs, but losing 100 factory jobs will result in the loss of roughly 122 non-factory jobs. In the table above, the data differs slightly because I am using the non-spatially adjusted estimates in these graphics. This estimate is more like what a local economic developer will see, while the spatially adjusted model will correct for the correlation of cross border flows (technical stuff, better read in the chapter).

The story changes for mid-sized urban places. Here, the job changes associated with losing a factory have always been worse than the employment benefits of getting a factory. I think this is because urban amenities and thick labor markets make people move to cities, and reluctant to leave them. That effects large cities, but just isn’t playing out in smaller cities.

For rural (non-urban) places, the multipliers have always been highly asymmetric, and it has worsened with time. Again, large cities have thick labor markets and amenities that anchor residents. Smaller urban places and rural counties have fewer. So, a positive job shock from a factory opening may bring some new non-factory jobs, but the negative shock causes fairly steep non-factory job losses.

These results offer a glimpse into the asymmetry of multipliers, and fits reasonably well into the existing academic research on this. This table illustrates the type of multiplier estimate I have performed, and does not include the input-output type estimates. Note there’s only one symmetry estimate (1983).

So, what are the implications of this.
Well, I think a lot of the multipliers used to justify economic development expansions are too large. Failure to examine the symmetry means that most (all outside large cities) will overstate the benefit, and understate the cost of a labor demand shock.
The policy implications of these findings go beyond the deployment of traditional multipliers for policy analysis. Asymmetric propagation of labor market shocks, declining effects and urban rural differentials all speak more broadly to the efficacy of traditional place based economic development efforts that focus on business attraction.
The findings reported in this study argue strongly against a resource allocation mix that favors business attraction policies. There are three compelling reasons against this. First, the benefits of business attraction have been declining over time. Second, outside of a few hundred very large metropolitan areas, the employment benefits of attracting new footloose firms are lower than the costs of losing these firms. Third, the use of symmetric multipliers to assess the benefits of attracting new firms is overstated everywhere except in the largest metropolitan areas.
These observations are more acutely true for small cities and rural locations. The multipliers presented in Tables 2 and 3, along with the graphical depiction in Figures 7 and 8 clearly demonstrate the asymmetry of effects of labor demand shocks. Growth in labor demand among footloose firms does less to improve subsequent footloose employment than negative shocks do to reduce non-footloose employment. This asymmetry argues against business attraction policies designed to induce positive labor demand shocks associated with footloose employment. There is little upside benefit, and lots of downside risk to such employment growth.
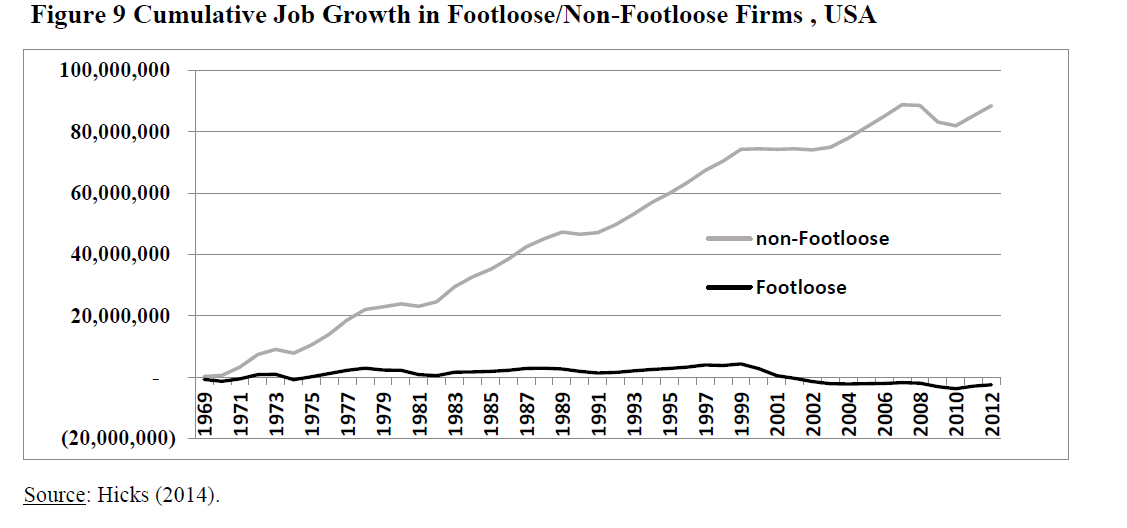
Many readers will have seen this before. If you are pursuing business attraction policies, you are chasing ‘footloose’ firms, the dark line below. These policies are resource intensive. These policies involve hundreds of billions of dollars of tax incentives, tens of billions of infrastructure spending and hundreds of millions of other local incentives.
Few low cost policies are bad, but if you are directing resources away from the non-footloose jobs, that require people to be present in your county, you are probably making a mistake.
So, in summary, these empirics use manufacturing employment to test footloose employment multipliers. Analysis of exporting multipliers, which would include non-footloose, but exporting firms such as agriculture or mining, would be a useful extension. This work would also be policy relevant, particularly in areas with significant natural resource extraction.
Despite these limitations, the findings that employment multipliers are asymmetric between positive and negative labor demand shocks, declining over time, and higher in urban, than in less urban places provides information that is relevant to public officials. These results should cause hesitation in the deployment of I-O multipliers for policy use, and cause considerable reconsideration of policies focusing on attracting footloose jobs to a region.
Multipliers for less urban areas may be influenced -especially in public spending- by reliance on out-of-town (i.e. big city) vendors (consultants, contracted services, whatever) for functions that *could* be performed by locals (even small private enterprises). I made this point a number of years ago when Columbus was moving into curbside recycling, contrasting the consequent flow of funds, eg "one-and-done" vs 'stickier' money cycling.
Waste Management, Rumpke (operates county landfill for 30 years and running!) and other vendors make for quick, easy, "no muss, no fuss" choices but so much of the contract $ flows immediately out of town to Cincinnati, Indianapolis, etc instead of cycling here for a couple of rounds. So, local govt -unwittingly- plays a not insignificant role in hollowing out less urban economies.